## Bar Chart: Relative Improvement (RI) by Answer Type
### Overview
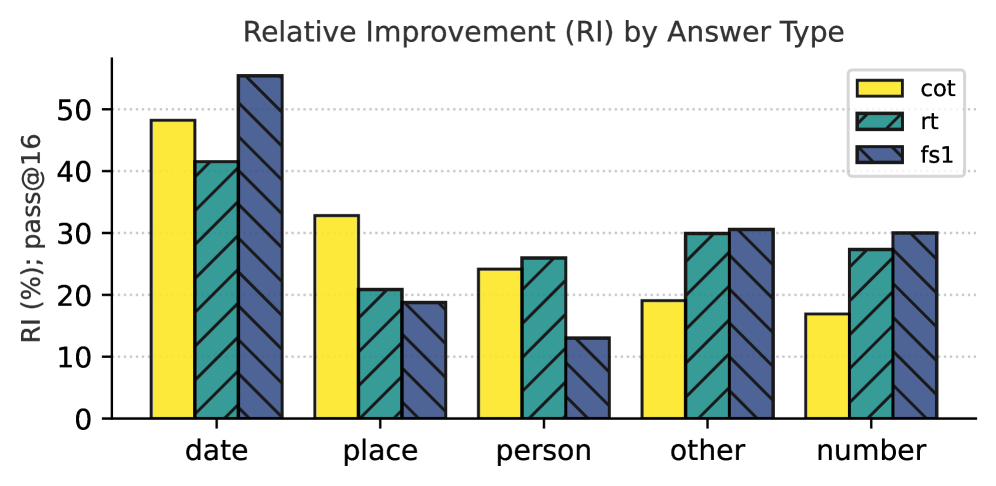
The chart visualizes the Relative Improvement (RI) percentage for three answer types (`cot`, `rt`, `fs1`) across five categories (`date`, `place`, `person`, `other`, `number`). The y-axis represents RI (%) relative to a baseline (`pass@16`), while the x-axis categorizes answer types. The legend in the top-right corner maps colors to answer types: yellow (`cot`), teal (`rt`), and blue with diagonal stripes (`fs1`).
### Components/Axes
- **X-axis**: Categories (`date`, `place`, `person`, `other`, `number`).
- **Y-axis**: RI (%) relative to `pass@16`, ranging from 0 to 55%.
- **Legend**: Located in the top-right corner, associating colors with answer types:
- Yellow: `cot`
- Teal: `rt`
- Blue (diagonal stripes): `fs1`
### Detailed Analysis
1. **Date**:
- `cot`: ~48% RI
- `rt`: ~42% RI
- `fs1`: ~55% RI (highest among all categories)
2. **Place**:
- `cot`: ~32% RI
- `rt`: ~20% RI
- `fs1`: ~19% RI (lowest in this category)
3. **Person**:
- `cot`: ~24% RI
- `rt`: ~26% RI
- `fs1`: ~13% RI (lowest RI for `fs1` across all categories)
4. **Other**:
- `cot`: ~19% RI
- `rt`: ~30% RI
- `fs1`: ~31% RI (highest RI for `fs1` in this category)
5. **Number**:
- `cot`: ~17% RI
- `rt`: ~27% RI
- `fs1`: ~30% RI
### Key Observations
- **`fs1` dominates in `date` and `other` categories**, achieving the highest RI (~55% and ~31%, respectively).
- **`cot` performs best in `place`** (~32% RI) but declines sharply in `person` and `number`.
- **`rt` shows moderate consistency**, with RI ranging from 20% (`place`) to 30% (`other`).
- **`fs1` underperforms in `person`** (~13% RI), significantly lower than other answer types in this category.
- **`cot` has the steepest decline** from `date` (~48%) to `number` (~17%).
### Interpretation
The data suggests that answer type effectiveness varies by category. `fs1` excels in `date` and `other` contexts, possibly due to its structural or contextual adaptability. `cot` performs well in `place` but struggles in `person` and `number`, indicating potential limitations in handling personal or numerical data. The drop in `fs1` RI for `person` (~13%) may reflect challenges in processing personal information. Overall, the chart highlights the importance of answer type selection based on the query category for optimizing RI.