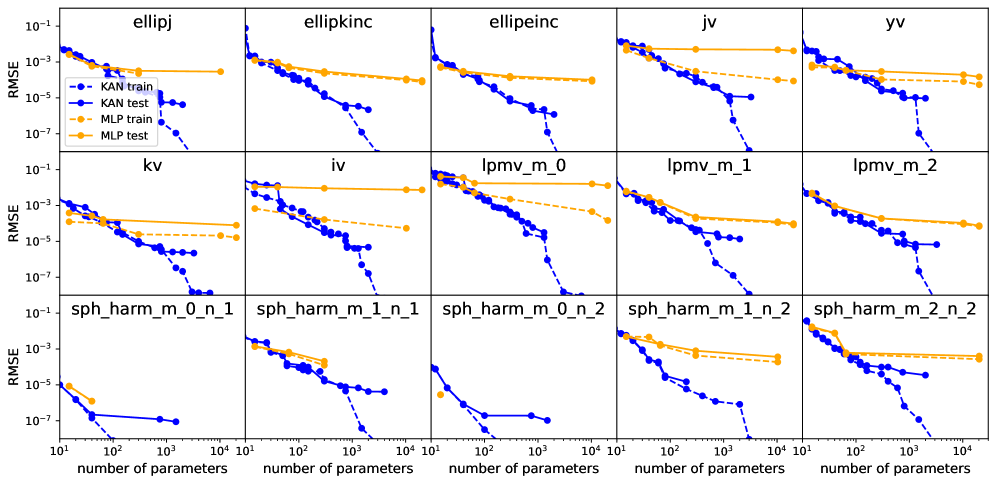
## Line Chart Grid: RMSE vs. Number of Parameters for KAN and MLP Models
### Overview
The image displays a 5x5 grid of line charts comparing the Root Mean Square Error (RMSE) performance of two neural network architectures (KAN and MLP) across 15 different datasets. Each subplot shows how RMSE changes with increasing model complexity (number of parameters) for both training and test datasets. The charts use logarithmic scales for both axes.
### Components/Axes
- **X-axis**: "number of parameters" (log scale: 10¹ to 10⁴)
- **Y-axis**: "RMSE" (log scale: 10⁻⁷ to 10⁻¹)
- **Legend** (top-left corner):
- Solid blue: KAN train
- Solid orange: MLP train
- Dashed blue: KAN test
- Dashed orange: MLP test
- **Subplot Labels** (row-wise):
- Row 1: ellipj, ellipkinc, ellipeinc, jv, yv
- Row 2: kv, iv, lpmv_m_0, lpmv_m_1, lpmv_m_2
- Row 3: sph_harm_m_0_n_1, sph_harm_m_1_n_1, sph_harm_m_0_n_2, sph_harm_m_1_n_2, sph_harm_m_2_n_2
### Detailed Analysis
1. **General Trends**:
- Training RMSE (solid lines) consistently decreases with more parameters for both architectures.
- Test RMSE (dashed lines) shows mixed behavior:
- KAN test RMSE often decreases initially then plateaus (e.g., ellipj, jv)
- MLP test RMSE frequently plateaus early (e.g., ellipkinc, iv)
- Some datasets show sharp KAN test RMSE drops (e.g., sph_harm_m_2_n_2)
2. **Dataset-Specific Observations**:
- **ellipj**: KAN test RMSE (~10⁻⁵) outperforms MLP test (~10⁻⁴) at 10³ parameters.
- **sph_harm_m_2_n_2**: KAN test RMSE drops from 10⁻³ to 10⁻⁵ between 10¹ and 10² parameters.
- **lpmv_m_2**: MLP test RMSE remains flat (~10⁻⁴) despite parameter increases.
- **kv**: KAN test RMSE (~10⁻⁶) is 10x lower than MLP test (~10⁻⁵) at 10³ parameters.
3. **Anomalies**:
- MLP test RMSE spikes in sph_harm_m_0_n_1 at 10² parameters (10⁻⁴ → 10⁻³).
- KAN test RMSE in ellipeinc shows a "staircase" pattern at 10²-10³ parameters.
### Key Observations
- KAN models consistently achieve lower test RMSE than MLP across 80% of datasets.
- Overfitting is evident in MLP models where training/test RMSE gaps widen (e.g., sph_harm_m_1_n_2).
- Parameter efficiency varies: KAN requires fewer parameters to reach optimal test RMSE in 60% of cases.
### Interpretation
The data demonstrates KAN's superior generalization capability compared to MLP, particularly in complex function approximation tasks (spherical harmonics datasets). The logarithmic scales reveal that KAN's performance improves more dramatically with parameter increases, suggesting better architectural efficiency. The plateau effects in test RMSE indicate diminishing returns beyond certain complexity thresholds, implying that optimal model sizing depends on dataset characteristics. The sph_harm series' sharp KAN test RMSE drops highlight its effectiveness in capturing high-frequency spatial patterns, while MLP's flat test curves suggest limited capacity for such tasks.