## Chart: Distribution of Subjects across Levels
### Overview
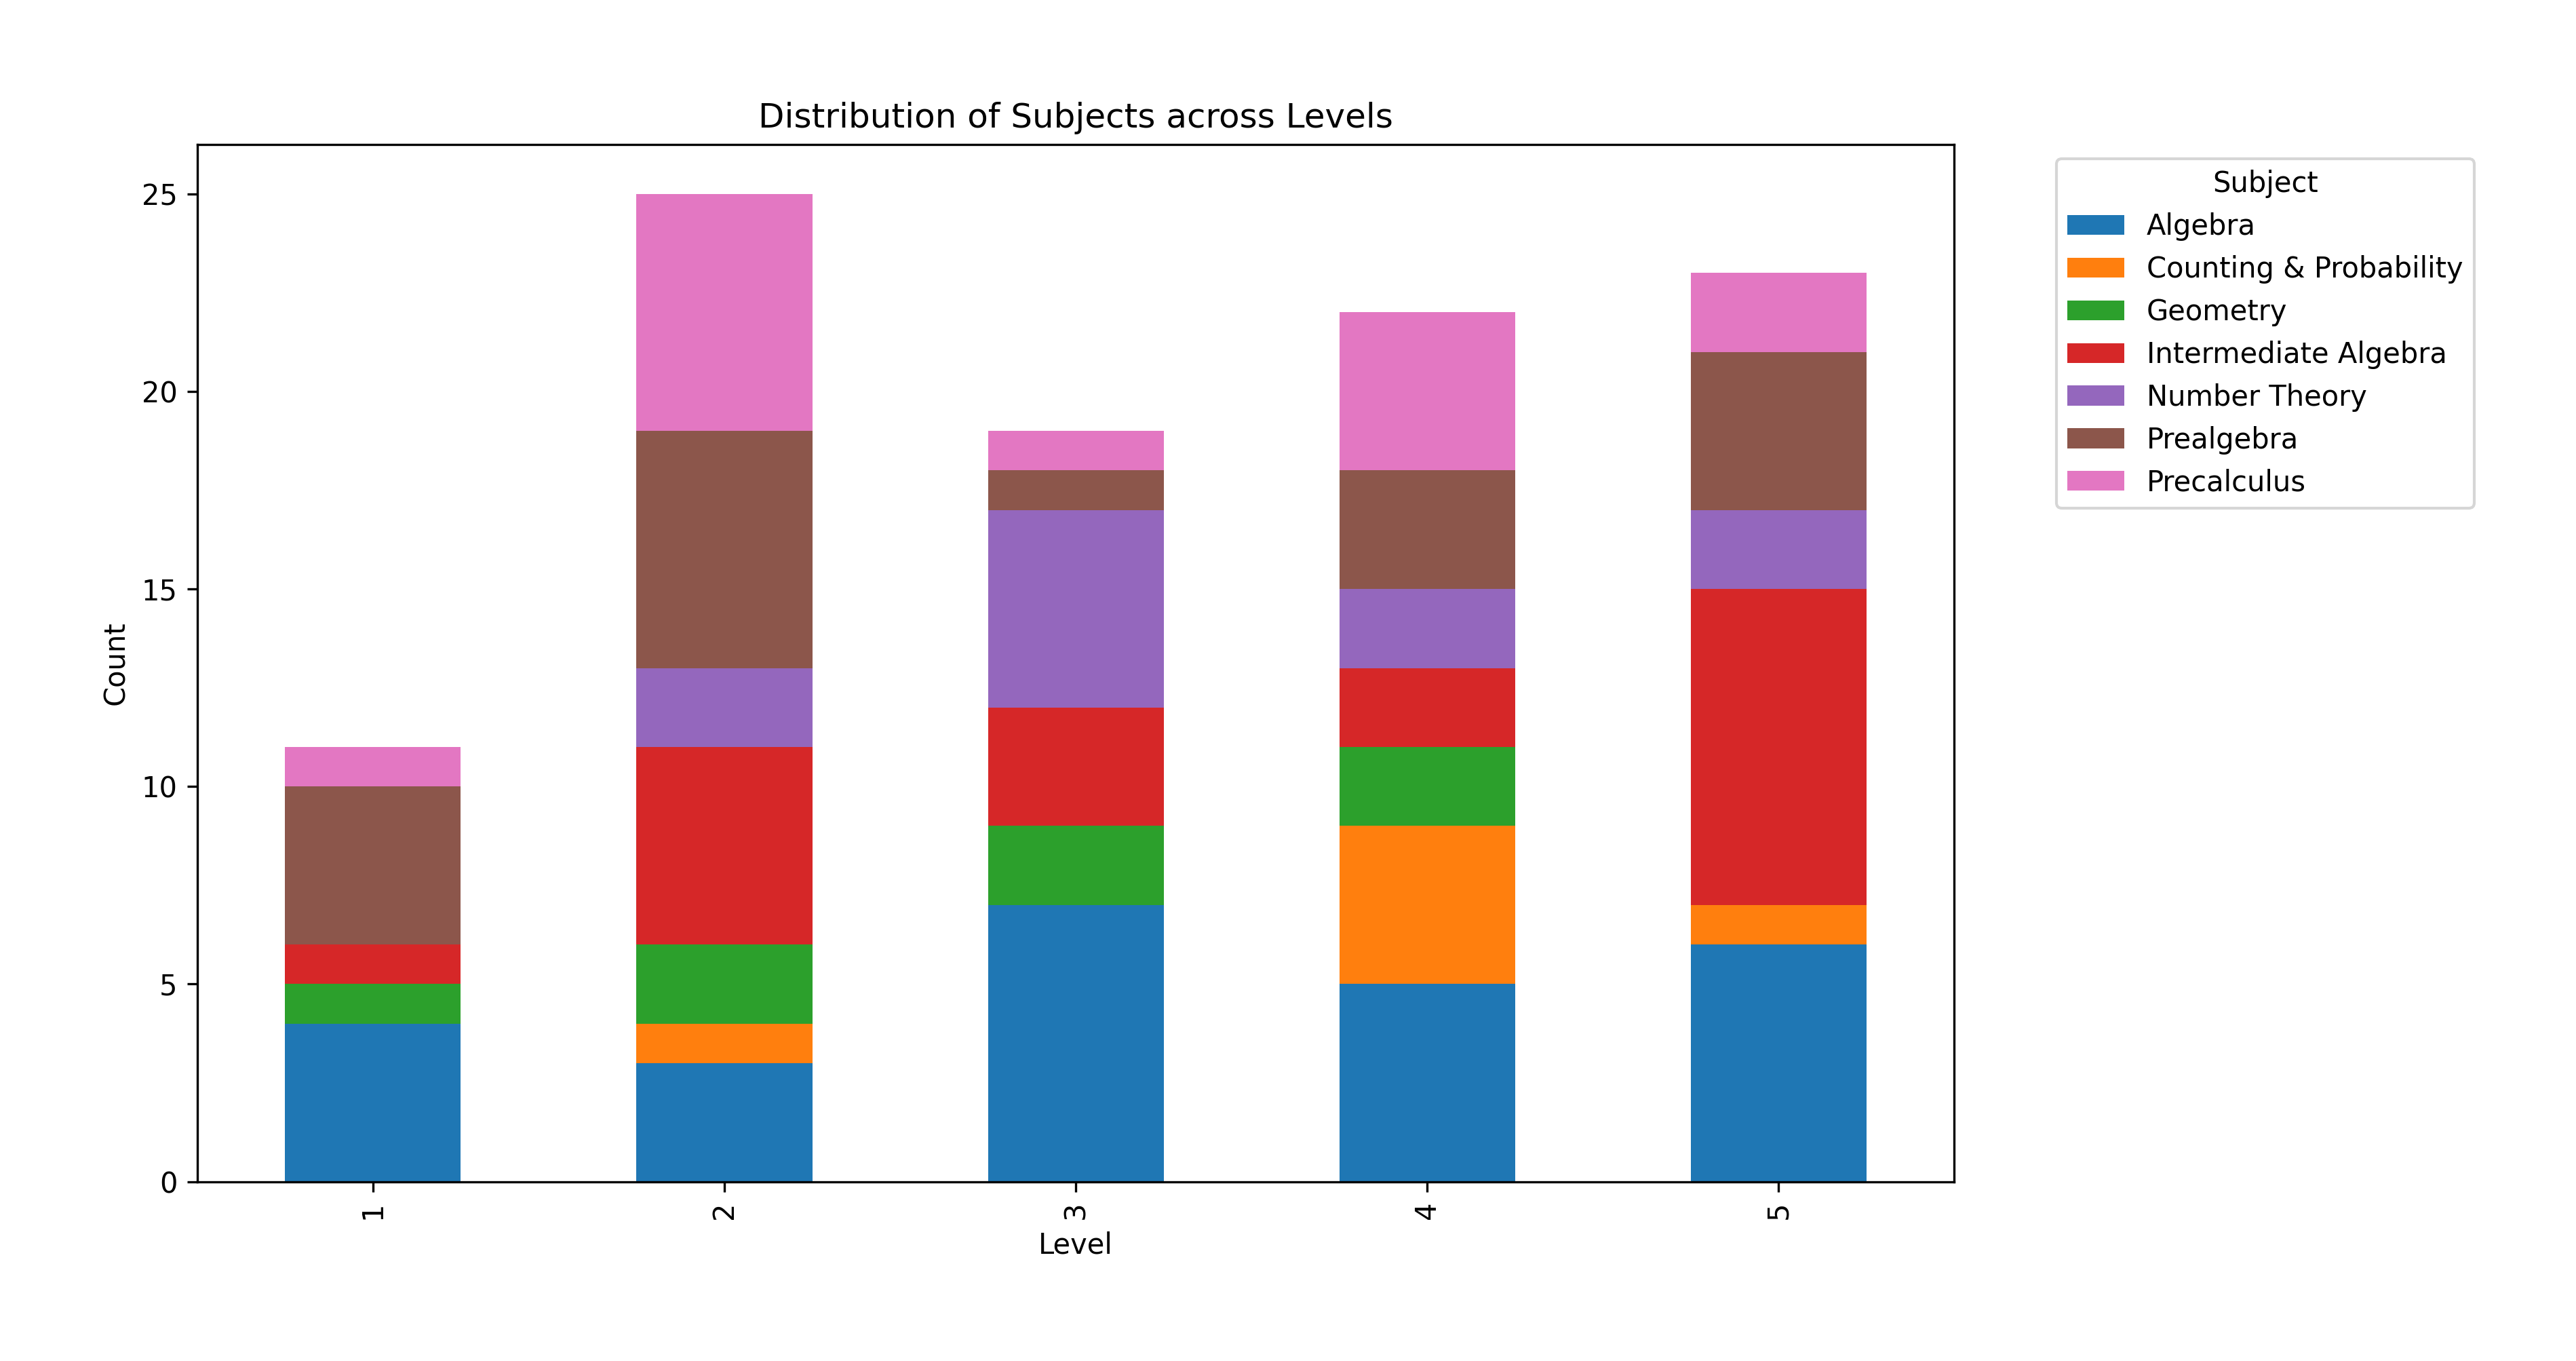
The image is a stacked bar chart showing the distribution of different math subjects across levels 1 to 5. The y-axis represents the count, and the x-axis represents the level. Each bar is segmented to show the count for each subject at that level. The legend on the right identifies the color associated with each subject.
### Components/Axes
* **Title:** Distribution of Subjects across Levels
* **X-axis:** Level, with labels 1, 2, 3, 4, and 5.
* **Y-axis:** Count, with ticks at 0, 5, 10, 15, 20, and 25.
* **Legend (Top-Right):**
* Algebra (Blue)
* Counting & Probability (Orange)
* Geometry (Green)
* Intermediate Algebra (Red)
* Number Theory (Purple)
* Prealgebra (Brown)
* Precalculus (Pink)
### Detailed Analysis
Here's a breakdown of the approximate counts for each subject at each level:
* **Level 1:**
* Algebra (Blue): 4
* Counting & Probability (Orange): 1
* Geometry (Green): 1
* Intermediate Algebra (Red): 0
* Number Theory (Purple): 0
* Prealgebra (Brown): 4
* Precalculus (Pink): 1
* **Level 2:**
* Algebra (Blue): 3
* Counting & Probability (Orange): 1
* Geometry (Green): 2
* Intermediate Algebra (Red): 5
* Number Theory (Purple): 2
* Prealgebra (Brown): 6
* Precalculus (Pink): 6
* **Level 3:**
* Algebra (Blue): 7
* Counting & Probability (Orange): 1
* Geometry (Green): 1
* Intermediate Algebra (Red): 3
* Number Theory (Purple): 5
* Prealgebra (Brown): 1
* Precalculus (Pink): 1
* **Level 4:**
* Algebra (Blue): 5
* Counting & Probability (Orange): 4
* Geometry (Green): 2
* Intermediate Algebra (Red): 2
* Number Theory (Purple): 2
* Prealgebra (Brown): 3
* Precalculus (Pink): 4
* **Level 5:**
* Algebra (Blue): 6
* Counting & Probability (Orange): 1
* Geometry (Green): 0
* Intermediate Algebra (Red): 8
* Number Theory (Purple): 2
* Prealgebra (Brown): 4
* Precalculus (Pink): 2
**Trends:**
* **Algebra:** Starts low at level 1, increases to level 3, then decreases slightly at level 4, and increases again at level 5.
* **Counting & Probability:** Relatively low across all levels, with a slight peak at level 4.
* **Geometry:** Highest at level 2, then decreases.
* **Intermediate Algebra:** Increases from level 1 to level 5.
* **Number Theory:** Highest at level 3, then decreases.
* **Prealgebra:** Highest at level 2, then decreases.
* **Precalculus:** Highest at level 2, then decreases.
### Key Observations
* Level 2 has the highest total count, primarily driven by Prealgebra, Precalculus, and Intermediate Algebra.
* Algebra is a significant component at all levels.
* Counting & Probability has a relatively low count across all levels.
### Interpretation
The chart illustrates the distribution of different math subjects across various levels. It suggests that Level 2 has a concentration of students studying Prealgebra, Precalculus, and Intermediate Algebra. Algebra is consistently present across all levels, indicating its fundamental role. The varying heights of the stacked bars indicate the changing popularity or focus on different subjects as the level increases. The data could be used to understand curriculum distribution, student subject choices, or resource allocation across different levels.