## Stacked Bar Chart: Distribution of Subjects across Levels
### Overview
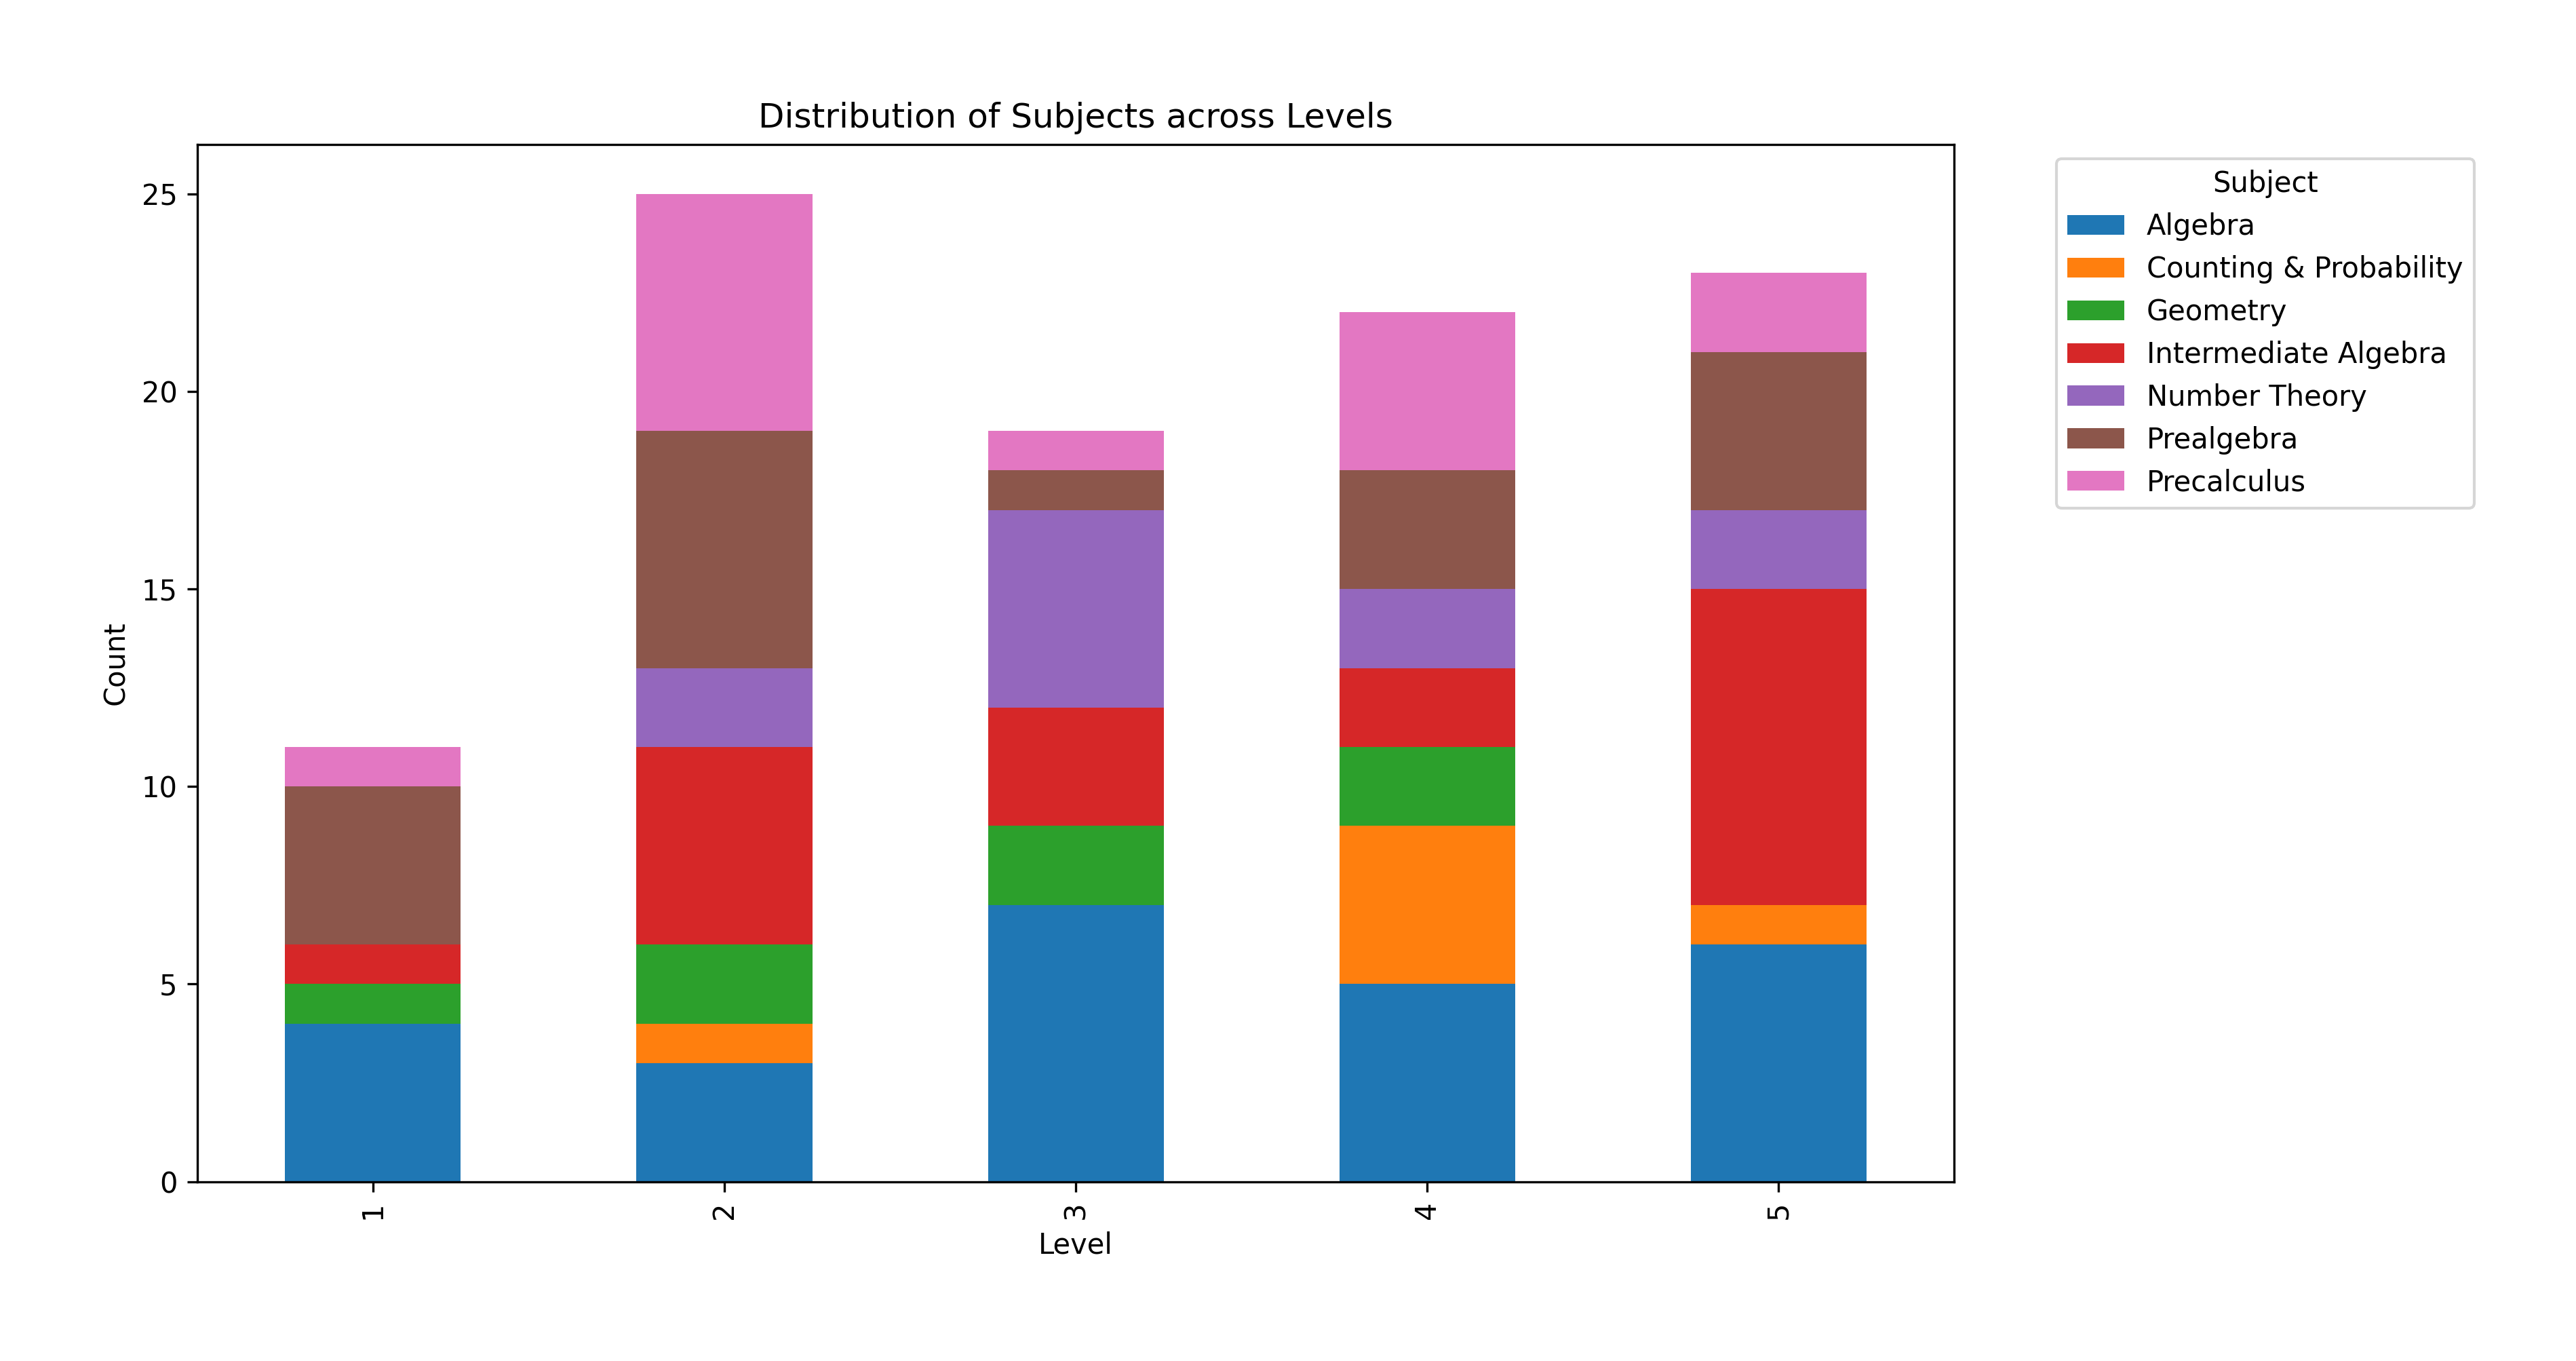
The image presents a stacked bar chart illustrating the distribution of different subjects across five levels. The y-axis represents the "Count" (likely the number of students or instances), while the x-axis represents the "Level" ranging from 1 to 5. Each bar is segmented to show the contribution of each subject to the total count at that level.
### Components/Axes
* **Title:** "Distribution of Subjects across Levels" (top-center)
* **X-axis Label:** "Level" (bottom-center)
* **X-axis Markers:** 1, 2, 3, 4, 5 (equally spaced)
* **Y-axis Label:** "Count" (left-center)
* **Y-axis Scale:** 0 to 25 (incrementing by 5)
* **Legend:** Located in the top-right corner, listing the subjects and their corresponding colors:
* Algebra (Dark Blue)
* Counting & Probability (Orange)
* Geometry (Green)
* Intermediate Algebra (Red)
* Number Theory (Brown)
* Prealgebra (Gray)
* Precalculus (Purple)
### Detailed Analysis
The chart consists of five stacked bars, one for each level. We will analyze each level individually, noting the approximate counts for each subject.
* **Level 1:**
* Algebra: ~6
* Counting & Probability: ~2
* Geometry: ~1
* Intermediate Algebra: ~0
* Number Theory: ~0
* Prealgebra: ~0
* Precalculus: ~3
* Total: ~12
* **Level 2:**
* Algebra: ~5
* Counting & Probability: ~2
* Geometry: ~4
* Intermediate Algebra: ~0
* Number Theory: ~0
* Prealgebra: ~0
* Precalculus: ~14
* Total: ~25
* **Level 3:**
* Algebra: ~7
* Counting & Probability: ~2
* Geometry: ~2
* Intermediate Algebra: ~0
* Number Theory: ~0
* Prealgebra: ~0
* Precalculus: ~10
* Total: ~21
* **Level 4:**
* Algebra: ~6
* Counting & Probability: ~3
* Geometry: ~3
* Intermediate Algebra: ~2
* Number Theory: ~1
* Prealgebra: ~0
* Precalculus: ~8
* Total: ~23
* **Level 5:**
* Algebra: ~6
* Counting & Probability: ~2
* Geometry: ~2
* Intermediate Algebra: ~1
* Number Theory: ~1
* Prealgebra: ~0
* Precalculus: ~11
* Total: ~23
**Trends:**
* Precalculus consistently represents the largest portion of students at each level.
* Algebra is consistently the second largest subject at each level.
* Intermediate Algebra, Number Theory, and Prealgebra have minimal representation across all levels.
* The total count appears to be highest at Level 2, and relatively consistent across Levels 3, 4, and 5.
### Key Observations
* Precalculus dominates the subject distribution across all levels.
* The contribution of Geometry and Counting & Probability is relatively stable across levels.
* Levels 1 and 3 have the lowest overall counts.
* The presence of Intermediate Algebra, Number Theory, and Prealgebra is minimal, suggesting these subjects are either less popular or offered at fewer levels.
### Interpretation
The chart demonstrates a clear emphasis on Precalculus across all levels, indicating its importance in the curriculum or student interest. The consistent presence of Algebra suggests it serves as a foundational subject. The low representation of Intermediate Algebra, Number Theory, and Prealgebra might indicate these are specialized courses or are taken by a smaller subset of students. The varying total counts across levels could reflect differences in class sizes or the number of students enrolled in each level. The data suggests a curriculum heavily focused on preparing students for Precalculus, with other subjects playing a supporting role. The chart provides a snapshot of subject distribution, which could be used to inform resource allocation, curriculum development, or student advising.