\n
## Chart: Accuracy vs. Number of Layers in Recurrence with Speedup over CoT
### Overview
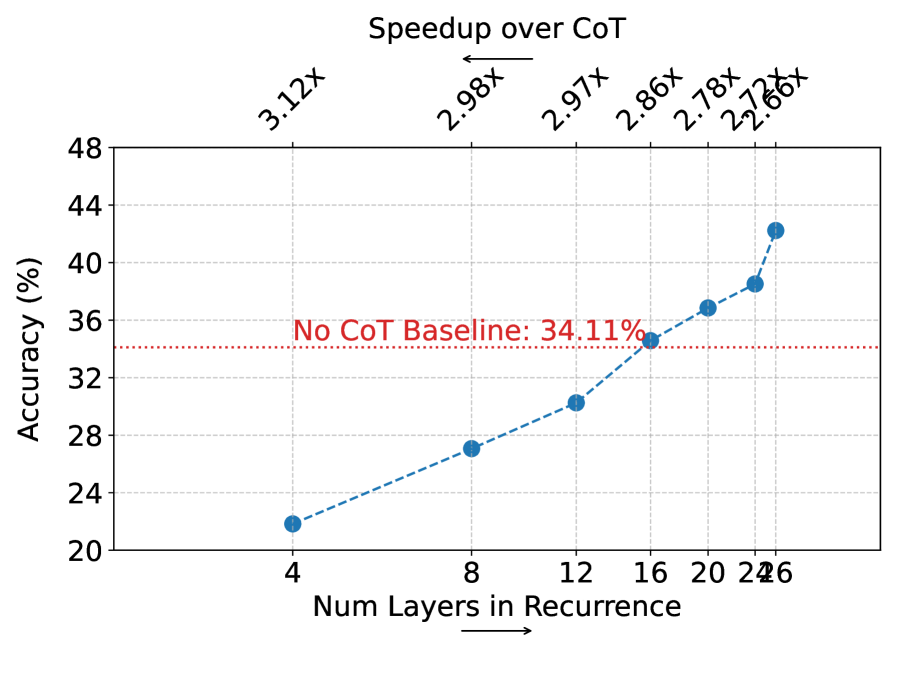
The image presents a line chart illustrating the relationship between the number of layers in recurrence and the resulting accuracy, alongside speedup factors compared to a "Chain of Thought" (CoT) baseline. A horizontal dashed line indicates the CoT baseline accuracy. Speedup values are displayed above the data points.
### Components/Axes
* **X-axis:** "Num Layers in Recurrence" - Scale ranges from 4 to 26, with markers at 4, 8, 12, 16, 20, and 24/26.
* **Y-axis:** "Accuracy (%)" - Scale ranges from 20 to 48, with markers at 20, 24, 28, 32, 36, 40, 44, and 48.
* **Data Series:** A single blue dashed line representing accuracy as a function of the number of layers.
* **Baseline:** A horizontal red dashed line labeled "No CoT Baseline: 34.11%".
* **Speedup Indicators:** Text labels above each data point indicating the speedup factor over the CoT baseline (e.g., "3.12x", "2.98x").
* **Legend:** No explicit legend is present, but the labels and line color clearly define the data series.
### Detailed Analysis
The blue dashed line shows an increasing trend in accuracy as the number of layers in recurrence increases.
* **4 Layers:** Accuracy is approximately 21%. Speedup is 3.12x.
* **8 Layers:** Accuracy is approximately 25%. Speedup is 2.98x.
* **12 Layers:** Accuracy is approximately 30%. Speedup is 2.97x.
* **16 Layers:** Accuracy is approximately 32%. Speedup is 2.86x.
* **20 Layers:** Accuracy is approximately 37%. Speedup is 2.78x.
* **24/26 Layers:** Accuracy is approximately 40%. Speedup is 2.76x.
The CoT baseline accuracy is fixed at 34.11%. The accuracy values surpass the baseline at approximately 16 layers.
### Key Observations
* Accuracy increases rapidly with the number of layers initially, then the rate of increase slows down.
* The speedup over CoT decreases slightly as the number of layers increases, but remains consistently above 2.76x.
* The accuracy surpasses the CoT baseline at 16 layers.
* The data suggests diminishing returns in accuracy gains with increasing layers beyond 16.
### Interpretation
The chart demonstrates that increasing the number of layers in recurrence improves accuracy, but with diminishing returns. The speedup over the CoT baseline indicates that this approach is significantly faster than the baseline method, even with a relatively small number of layers. The CoT baseline represents a performance threshold. The data suggests that a model with around 16-20 layers provides a good balance between accuracy and speedup. The slight decrease in speedup with increasing layers might indicate increased computational cost outweighing the marginal accuracy gains. The chart implies that the recurrence-based approach is a viable alternative to CoT, offering both improved accuracy and efficiency. The data points are relatively sparse, so interpolation between them should be done with caution.