## Line Chart: Speedup over CoT vs. Number of Recurrence Layers
### Overview
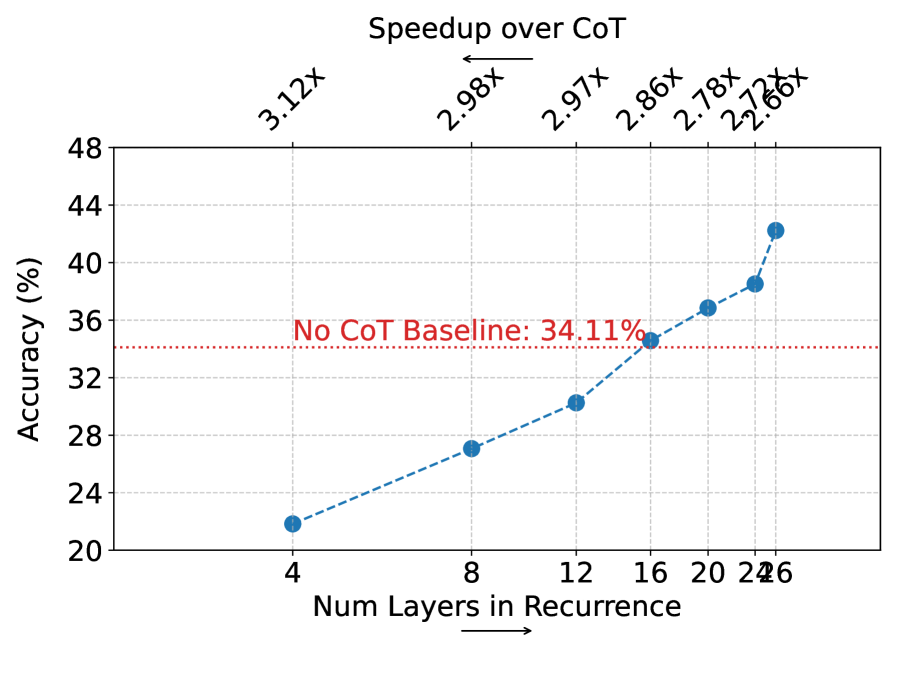
This is a line chart plotting model accuracy against the number of layers used in a recurrence mechanism. It includes a secondary top axis showing the corresponding "Speedup over CoT" (Chain-of-Thought) for each data point. A horizontal baseline indicates the accuracy achieved without using CoT.
### Components/Axes
* **Main Title:** "Speedup over CoT" (centered at the top, with a left-pointing arrow).
* **X-Axis (Bottom):** Label: "Num Layers in Recurrence" (with a right-pointing arrow). Scale: Discrete values at 4, 8, 12, 16, 20, 24, and 26.
* **Y-Axis (Left):** Label: "Accuracy (%)". Scale: Linear from 20 to 48, with major ticks every 4 units (20, 24, 28, 32, 36, 40, 44, 48).
* **Secondary X-Axis (Top):** Displays "Speedup over CoT" multipliers corresponding to each data point below. Values: 3.12x, 2.98x, 2.97x, 2.86x, 2.78x, 2.72x, 2.66x.
* **Data Series:** A single series represented by a blue dashed line with circular markers.
* **Baseline Reference:** A horizontal red dotted line across the chart at y=34.11%, labeled "No CoT Baseline: 34.11%" in red text, positioned just above the line near the center.
### Detailed Analysis
**Data Points (Approximate Values):**
The blue line shows a clear, monotonically increasing trend in accuracy as the number of recurrence layers increases.
1. **4 Layers:** Accuracy ≈ 22%. Corresponding Speedup = 3.12x.
2. **8 Layers:** Accuracy ≈ 27%. Corresponding Speedup = 2.98x.
3. **12 Layers:** Accuracy ≈ 30%. Corresponding Speedup = 2.97x.
4. **16 Layers:** Accuracy ≈ 35%. Corresponding Speedup = 2.86x. *This point is just above the "No CoT Baseline" of 34.11%.*
5. **20 Layers:** Accuracy ≈ 37%. Corresponding Speedup = 2.78x.
6. **24 Layers:** Accuracy ≈ 38%. Corresponding Speedup = 2.72x.
7. **26 Layers:** Accuracy ≈ 42%. Corresponding Speedup = 2.66x.
**Trend Verification:**
* **Accuracy Trend (Blue Line):** Slopes consistently upward from left to right. The increase is relatively steady, with a slightly steeper rise between 24 and 26 layers.
* **Speedup Trend (Top Axis Values):** Decreases monotonically from left to right (from 3.12x down to 2.66x) as the number of layers increases.
### Key Observations
1. **Trade-off Revealed:** There is a clear inverse relationship between accuracy and speedup. As the model's accuracy improves with more recurrence layers, its computational speedup over a CoT baseline diminishes.
2. **Baseline Crossover:** The model surpasses the "No CoT Baseline" accuracy (34.11%) at approximately 16 recurrence layers.
3. **Diminishing Returns on Speedup:** The largest drop in speedup (from 3.12x to 2.98x) occurs between 4 and 8 layers, while the accuracy gain is moderate. The smallest speedup decrease (2.72x to 2.66x) occurs between 24 and 26 layers, where the accuracy gain is the most pronounced.
4. **Spatial Layout:** The "No CoT Baseline" label is placed centrally for immediate reference. The speedup values are aligned directly above their corresponding data points for easy correlation.
### Interpretation
The chart demonstrates a fundamental engineering trade-off in the design of this recurrent model architecture. **Increasing the depth of recurrence (more layers) is an effective strategy for boosting task accuracy**, allowing the model to eventually outperform a standard non-CoT approach.
However, this accuracy gain comes at a direct **computational cost, measured as a reduction in inference speedup** relative to a CoT method. The "Speedup over CoT" metric suggests that while the recurrent model is faster than CoT in all shown configurations (all multipliers >1), its speed advantage erodes as it becomes more accurate.
The data suggests an optimization problem: selecting the number of recurrence layers involves balancing the desired accuracy against acceptable inference latency. The point at 16 layers represents a potential "sweet spot" where the model first exceeds the baseline accuracy while still maintaining a significant speedup (2.86x). The sharp accuracy increase at 26 layers might indicate a threshold where the added complexity yields disproportionate performance benefits, albeit with the lowest speedup in the series.