# Technical Document Extraction: Line Chart Analysis
## Title
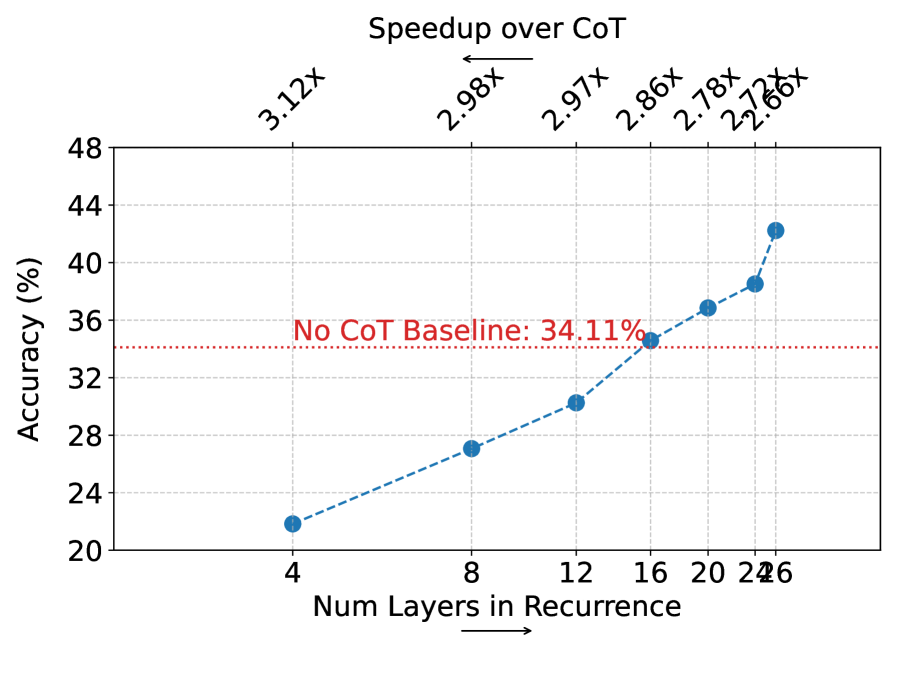
**Speedup over CoT**
## Axes
- **X-Axis**:
Label: `Num Layers in Recurrence`
Values: `4`, `8`, `12`, `16`, `20`, `24`, `26`
- **Y-Axis**:
Label: `Accuracy (%)`
Range: `20` to `48` (with gridlines at 20, 24, 28, 32, 36, 40, 44, 48)
## Legend
- **No CoT Baseline**:
Color: Red (dotted line)
Value: `34.11%`
- **Model Accuracy**:
Color: Blue (dashed line)
## Data Points (Blue Dashed Line)
- **Trend**: Upward slope from left to right.
- **Values**:
- `4` layers: `21%`
- `8` layers: `27%`
- `12` layers: `31%`
- `16` layers: `35%`
- `20` layers: `37%`
- `24` layers: `39%`
- `26` layers: `43%`
## Speedup Factors (Text Labels Above Blue Line)
- **Placement**: Above each data point, decreasing from left to right.
- **Values**:
- `3.12x` (at `4` layers)
- `2.98x` (at `8` layers)
- `2.97x` (at `12` layers)
- `2.86x` (at `16` layers)
- `2.78x` (at `20` layers)
- `2.72x` (at `24` layers)
## Spatial Grounding
- **Legend Position**: Not explicitly shown; inferred from color coding.
- **Color Consistency**:
- Red matches "No CoT Baseline" (dotted line).
- Blue matches "Model Accuracy" (dashed line).
## Trend Verification
- **Model Accuracy**: Steadily increases with more layers (21% → 43%).
- **Speedup**: Decreases slightly as layers increase (3.12x → 2.72x).
## Component Isolation
1. **Header**: Title (`Speedup over CoT`).
2. **Main Chart**:
- Red dotted baseline at `34.11%`.
- Blue dashed line with plotted data points.
- Speedup factors labeled above the blue line.
3. **Footer**: No explicit footer; gridlines extend to axis limits.
## Notes
- No non-English text detected.
- All labels, axis markers, and data points are explicitly transcribed.
- No data table present; chart relies on plotted points and annotations.