## Chart: Evaluation Accuracy and Training Reward vs. Training Steps for Different Algorithms
### Overview
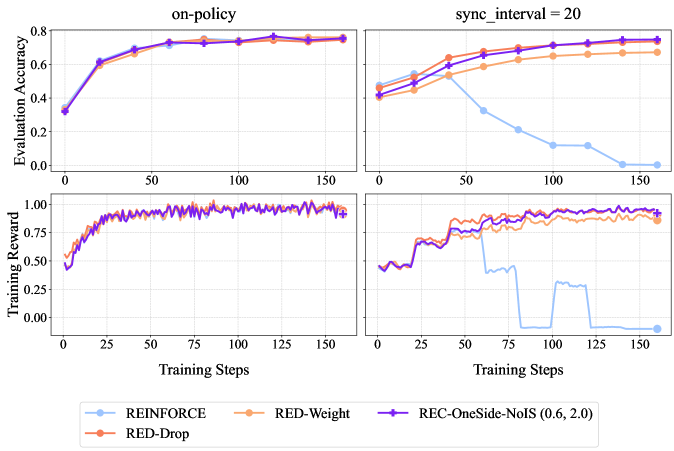
The image presents four line graphs arranged in a 2x2 grid. The graphs depict the performance of different reinforcement learning algorithms, namely REINFORCE, RED-Weight, REC-OneSide-NoIS (0.6, 2.0), and RED-Drop, across varying training steps. The top row displays "Evaluation Accuracy" while the bottom row displays "Training Reward". The left column shows results for "on-policy" training, and the right column shows results for "sync_interval = 20".
### Components/Axes
**General:**
* **X-axis (all plots):** Training Steps, ranging from 0 to 150. Increments are marked at 0, 25, 50, 75, 100, 125, and 150.
* **Legend (bottom):** Located below the four plots.
* REINFORCE (light blue)
* RED-Drop (orange-red)
* RED-Weight (light orange)
* REC-OneSide-NoIS (0.6, 2.0) (purple)
**Top-Left Plot (on-policy, Evaluation Accuracy):**
* **Title:** on-policy
* **Y-axis:** Evaluation Accuracy, ranging from 0.0 to 0.8, with increments of 0.2.
**Top-Right Plot (sync_interval = 20, Evaluation Accuracy):**
* **Title:** sync_interval = 20
* **Y-axis:** Evaluation Accuracy, ranging from 0.0 to 0.8, with increments of 0.2.
**Bottom-Left Plot (on-policy, Training Reward):**
* **Y-axis:** Training Reward, ranging from 0.00 to 1.00, with increments of 0.25.
**Bottom-Right Plot (sync_interval = 20, Training Reward):**
* **Y-axis:** Training Reward, ranging from 0.00 to 1.00, with increments of 0.25.
### Detailed Analysis
**Top-Left Plot (on-policy, Evaluation Accuracy):**
* **REINFORCE (light blue):** Starts at approximately 0.35, increases sharply to around 0.65 by step 25, and then plateaus around 0.75.
* **RED-Drop (orange-red):** Starts at approximately 0.35, increases sharply to around 0.60 by step 25, and then plateaus around 0.75.
* **RED-Weight (light orange):** Starts at approximately 0.35, increases sharply to around 0.65 by step 25, and then plateaus around 0.75.
* **REC-OneSide-NoIS (0.6, 2.0) (purple):** Starts at approximately 0.35, increases sharply to around 0.70 by step 25, and then plateaus around 0.78.
**Top-Right Plot (sync_interval = 20, Evaluation Accuracy):**
* **REINFORCE (light blue):** Starts at approximately 0.50, increases slightly to around 0.55 by step 25, then decreases steadily to approximately 0.05 by step 150.
* **RED-Drop (orange-red):** Starts at approximately 0.40, increases steadily to around 0.70 by step 75, and then plateaus around 0.70.
* **RED-Weight (light orange):** Starts at approximately 0.50, increases steadily to around 0.65 by step 75, and then plateaus around 0.65.
* **REC-OneSide-NoIS (0.6, 2.0) (purple):** Starts at approximately 0.45, increases steadily to around 0.75 by step 75, and then plateaus around 0.78.
**Bottom-Left Plot (on-policy, Training Reward):**
* **REINFORCE (light blue):** Starts at approximately 0.55, increases sharply to around 0.90 by step 25, and then fluctuates around 0.95.
* **RED-Drop (orange-red):** Starts at approximately 0.55, increases sharply to around 0.85 by step 25, and then fluctuates around 0.95.
* **RED-Weight (light orange):** Starts at approximately 0.55, increases sharply to around 0.90 by step 25, and then fluctuates around 0.95.
* **REC-OneSide-NoIS (0.6, 2.0) (purple):** Starts at approximately 0.45, increases sharply to around 0.90 by step 25, and then fluctuates around 0.95.
**Bottom-Right Plot (sync_interval = 20, Training Reward):**
* **REINFORCE (light blue):** Starts at approximately 0.60, increases to around 0.70 by step 25, then drops sharply and fluctuates between 0.00 and 0.25 after step 75.
* **RED-Drop (orange-red):** Starts at approximately 0.60, increases steadily to around 0.90 by step 50, and then fluctuates around 0.95.
* **RED-Weight (light orange):** Starts at approximately 0.60, increases steadily to around 0.85 by step 50, and then fluctuates around 0.95.
* **REC-OneSide-NoIS (0.6, 2.0) (purple):** Starts at approximately 0.55, increases steadily to around 0.85 by step 50, and then fluctuates around 0.95.
### Key Observations
* In the "on-policy" setting, all algorithms achieve similar performance in terms of both evaluation accuracy and training reward.
* In the "sync_interval = 20" setting, REINFORCE performs significantly worse than the other algorithms, particularly in terms of evaluation accuracy and training reward. The other three algorithms (RED-Weight, REC-OneSide-NoIS, and RED-Drop) maintain relatively high performance.
* The "sync_interval = 20" setting seems to negatively impact REINFORCE's ability to learn and maintain a high reward.
### Interpretation
The data suggests that the "sync_interval = 20" setting introduces a challenge that REINFORCE struggles to overcome, while RED-Weight, REC-OneSide-NoIS, and RED-Drop are more robust to this condition. This could be due to the way REINFORCE updates its policy, making it more sensitive to delayed or infrequent synchronization. The other algorithms may employ techniques that mitigate the impact of asynchronous updates. The "on-policy" setting, where updates are more frequent and synchronized, allows REINFORCE to perform comparably to the other algorithms. The REC-OneSide-NoIS algorithm consistently achieves slightly higher evaluation accuracy than the other algorithms.