## Line Graphs: Algorithm Performance Comparison
### Overview
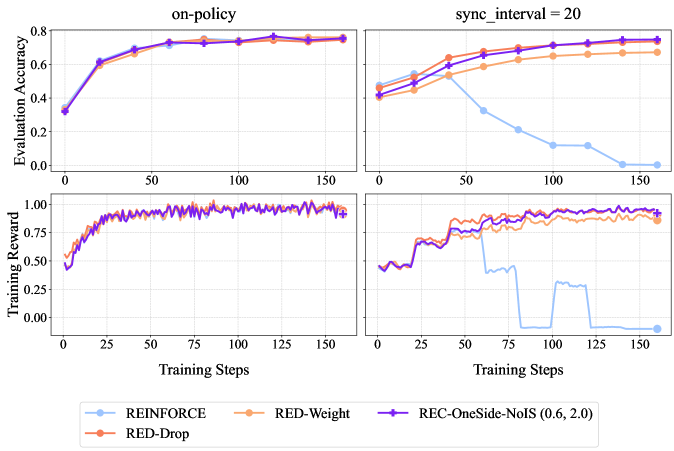
The image contains four line graphs arranged in a 2x2 grid, comparing the performance of four reinforcement learning algorithms (REINFORCE, RED-Drop, RED-Weight, REC-OneSide-NoIS) across different training metrics. The graphs show evaluation accuracy and training reward trends over training steps, with distinct performance patterns emerging between the algorithms.
### Components/Axes
1. **Top-Left Graph**
- **Title**: "on-policy"
- **Y-Axis**: Evaluation Accuracy (0.0 to 0.8)
- **X-Axis**: Training Steps (0 to 150)
- **Legend**:
- Blue: REINFORCE
- Orange: RED-Drop
- Purple: REC-OneSide-NoIS (0.6, 2.0)
- Red: RED-Weight
2. **Top-Right Graph**
- **Title**: "sync_interval = 20"
- **Y-Axis**: Evaluation Accuracy (0.0 to 0.8)
- **X-Axis**: Training Steps (0 to 150)
- **Legend**: Same as top-left graph
3. **Bottom-Left Graph**
- **Title**: "Training Reward"
- **Y-Axis**: Training Reward (0.0 to 1.0)
- **X-Axis**: Training Steps (0 to 150)
- **Legend**: Same as top-left graph
4. **Bottom-Right Graph**
- **Title**: "Training Reward"
- **Y-Axis**: Training Reward (0.0 to 1.0)
- **X-Axis**: Training Steps (0 to 150)
- **Legend**: Same as top-left graph
### Detailed Analysis
#### Top-Left Graph ("on-policy")
- **Trend**: All algorithms show upward trajectories, plateauing near 0.75–0.8 evaluation accuracy.
- **Data Points**:
- REINFORCE (blue): Starts at ~0.35, peaks at ~0.78 by 150 steps.
- RED-Drop (orange): Starts at ~0.38, peaks at ~0.77.
- REC-OneSide-NoIS (purple): Starts at ~0.32, peaks at ~0.79.
- RED-Weight (red): Starts at ~0.36, peaks at ~0.78.
#### Top-Right Graph ("sync_interval = 20")
- **Trend**: REINFORCE (blue) drops sharply after 50 steps, while others improve.
- **Data Points**:
- REINFORCE: Starts at ~0.45, drops to ~0.15 by 150 steps.
- RED-Drop: Starts at ~0.42, peaks at ~0.72.
- REC-OneSide-NoIS: Starts at ~0.40, peaks at ~0.76.
- RED-Weight: Starts at ~0.44, peaks at ~0.74.
#### Bottom-Left Graph ("Training Reward")
- **Trend**: All algorithms show gradual improvement with minor fluctuations.
- **Data Points**:
- REINFORCE: Starts at ~0.5, peaks at ~0.95.
- RED-Drop: Starts at ~0.52, peaks at ~0.98.
- REC-OneSide-NoIS: Starts at ~0.55, peaks at ~0.97.
- RED-Weight: Starts at ~0.53, peaks at ~0.96.
#### Bottom-Right Graph ("Training Reward")
- **Trend**: REINFORCE (blue) exhibits erratic drops, while others stabilize.
- **Data Points**:
- REINFORCE: Starts at ~0.5, drops to ~0.0 by 150 steps.
- RED-Drop: Starts at ~0.52, stabilizes at ~0.95.
- REC-OneSide-NoIS: Starts at ~0.55, stabilizes at ~0.94.
- RED-Weight: Starts at ~0.53, stabilizes at ~0.93.
### Key Observations
1. **On-Policy Performance**: All algorithms achieve high evaluation accuracy (~0.75–0.8) under on-policy training, with REC-OneSide-NoIS slightly outperforming others.
2. **Sync Interval Impact**: REINFORCE’s evaluation accuracy collapses under sync_interval = 20, while other algorithms maintain performance.
3. **Training Reward Variance**: REINFORCE shows unstable training rewards in sync_interval scenarios, whereas RED-Drop and REC-OneSide-NoIS maintain consistent rewards.
### Interpretation
- **Algorithm Robustness**: RED-Drop and REC-OneSide-NoIS demonstrate superior stability across training scenarios, suggesting better generalization.
- **REINFORCE Limitations**: REINFORCE’s performance degrades significantly under sync_interval constraints, indicating sensitivity to hyperparameters or training dynamics.
- **Training Reward Correlation**: Higher training rewards align with better evaluation accuracy, except for REINFORCE in sync_interval settings, where reward and accuracy decouple.
- **Practical Implications**: Algorithms with adaptive mechanisms (e.g., RED-Drop, REC-OneSide-NoIS) may be preferable for real-world applications requiring stable training under varying conditions.
*Note: All values are approximate, derived from visual inspection of the graphs.*