\n
## Bar Charts: Model Performance Across Benchmarks
### Overview
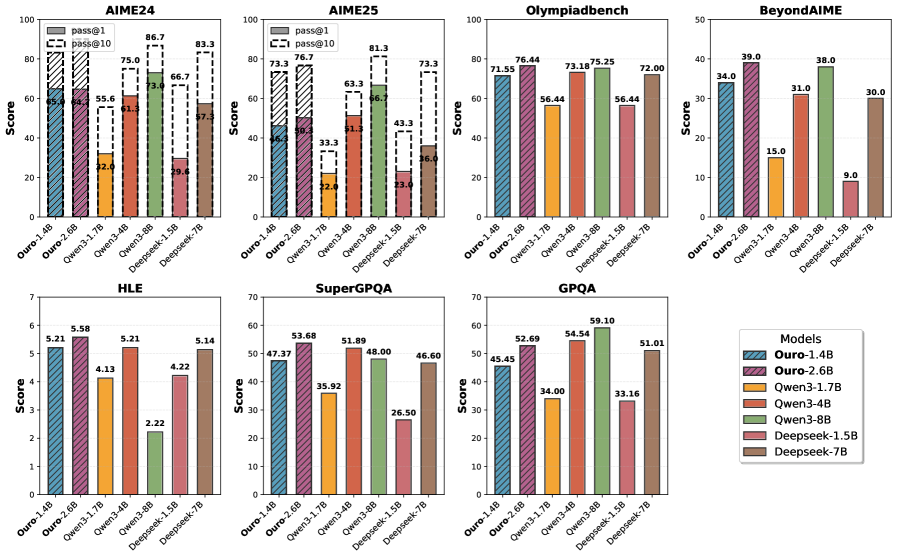
The image presents a series of bar charts comparing the performance of different models (Ouro-1.4B, Ouro-2.6B, Owen-3.1B, Owen-3.4B, Deepseek-1.5B, Deepseek-7B) across seven different benchmarks: AIME24, AIME25, Olympiadbench, BeyondAIME, HLE, SuperGPQA, and GPQA. The y-axis represents a "Score", and the x-axis represents the different models. Error bars are present on most bars, indicating the range of scores.
### Components/Axes
* **Y-axis (all charts):** "Score". Scales vary per chart.
* **X-axis (all charts):** Model names: "Ouro-1.4B", "Ouro-2.6B", "Owen-3.1B", "Owen-3.4B", "Deepseek-1.5B", "Deepseek-7B".
* **Legend (bottom-right):**
* Ouro-1.4B (Yellow)
* Ouro-2.6B (Green)
* Owen-3.1B (Light Blue)
* Owen-3.4B (Purple)
* Deepseek-1.5B (Red)
* Deepseek-7B (Dark Blue)
* **Chart Titles (top-center):** AIME24, AIME25, Olympiadbench, BeyondAIME, HLE, SuperGPQA, GPQA.
* **AIME24 & AIME25 Charts:** Include a label "pass@10" with a corresponding score value.
### Detailed Analysis or Content Details
**AIME24:**
* Ouro-1.4B: ~55.6 (with error bar ranging from ~22 to ~87)
* Ouro-2.6B: ~75.0 (with error bar ranging from ~52 to ~96)
* Owen-3.1B: ~66.7 (with error bar ranging from ~33 to ~86)
* Owen-3.4B: ~83.3 (with error bar ranging from ~57 to ~95)
* Deepseek-1.5B: ~57.3 (with error bar ranging from ~29 to ~86)
* Deepseek-7B: ~86.7 (with error bar ranging from ~61 to ~98)
* pass@10: ~80
**AIME25:**
* Ouro-1.4B: ~33.3 (with error bar ranging from ~22 to ~43)
* Ouro-2.6B: ~63.3 (with error bar ranging from ~43 to ~81)
* Owen-3.1B: ~51.3 (with error bar ranging from ~33 to ~66)
* Owen-3.4B: ~73.3 (with error bar ranging from ~52 to ~91)
* Deepseek-1.5B: ~43.3 (with error bar ranging from ~23 to ~66)
* Deepseek-7B: ~86.6 (with error bar ranging from ~66 to ~98)
* pass@10: ~81
**Olympiadbench:**
* Ouro-1.4B: ~76.4 (with error bar ranging from ~56 to ~94)
* Ouro-2.6B: ~75.25 (with error bar ranging from ~54 to ~94)
* Owen-3.1B: ~72.0 (with error bar ranging from ~52 to ~90)
* Owen-3.4B: ~73.18 (with error bar ranging from ~53 to ~91)
* Deepseek-1.5B: ~56.44 (with error bar ranging from ~36 to ~76)
* Deepseek-7B: ~72.00 (with error bar ranging from ~52 to ~90)
**BeyondAIME:**
* Ouro-1.4B: ~39.0
* Ouro-2.6B: ~31.0
* Owen-3.1B: ~15.0
* Owen-3.4B: ~30.0
* Deepseek-1.5B: ~9.0
* Deepseek-7B: ~38.0
**HLE:**
* Ouro-1.4B: ~5.21
* Ouro-2.6B: ~5.58
* Owen-3.1B: ~4.13
* Owen-3.4B: ~5.21
* Deepseek-1.5B: ~4.22
* Deepseek-7B: ~5.14
**SuperGPQA:**
* Ouro-1.4B: ~53.68
* Ouro-2.6B: ~47.37
* Owen-3.1B: ~29.83
* Owen-3.4B: ~48.00
* Deepseek-1.5B: ~46.60
* Deepseek-7B: ~51.89
**GPQA:**
* Ouro-1.4B: ~52.69
* Ouro-2.6B: ~54.54
* Owen-3.1B: ~33.16
* Owen-3.4B: ~51.01
* Deepseek-1.5B: ~45.45
* Deepseek-7B: ~59.10
### Key Observations
* Deepseek-7B consistently performs well across all benchmarks, often achieving the highest scores.
* Ouro-2.6B and Owen-3.4B generally outperform Ouro-1.4B and Owen-3.1B.
* The error bars indicate significant variability in the scores, particularly for the smaller models.
* BeyondAIME has a much lower overall score range compared to other benchmarks.
* The "pass@10" metric on AIME24 and AIME25 is consistently high (~80).
### Interpretation
The data suggests that model size is a significant factor in performance, with larger models (Deepseek-7B, Owen-3.4B, Ouro-2.6B) generally outperforming smaller models (Ouro-1.4B, Owen-3.1B, Deepseek-1.5B). The consistent high performance of Deepseek-7B indicates its strong capabilities across a variety of reasoning tasks. The large error bars suggest that the performance of the smaller models is more sensitive to the specific input or evaluation conditions. The differences in score ranges across benchmarks suggest that some benchmarks are more challenging or discriminating than others. The "pass@10" metric on AIME24 and AIME25 indicates a relatively high success rate when considering the top 10 predictions. This could be a measure of the model's ability to generate plausible answers, even if they are not always correct. The data provides a comparative analysis of different models, allowing for informed decisions about which model to use for specific applications.