## Line Graphs: Effective Rank Comparison (128M)
### Overview
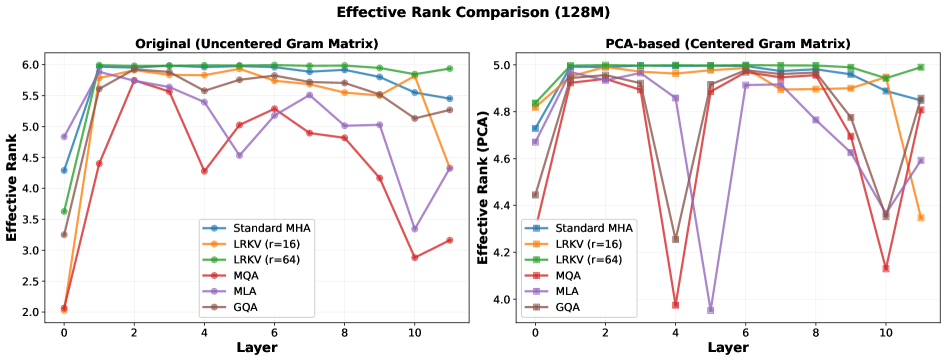
The image contains two side-by-side line graphs comparing the effective rank of different attention mechanisms across transformer layers. The left graph uses an "Original (Uncentered Gram Matrix)" framework, while the right graph uses a "PCA-based (Centered Gram Matrix)" approach. Both graphs show six distinct data series representing different methods, with layers (0-10) on the x-axis and effective rank values on the y-axis.
### Components/Axes
**Left Graph (Original):**
- **X-axis (Layer):** Integer values 0-10
- **Y-axis (Effective Rank):** Continuous scale 2.0-6.0
- **Legend:** Positioned bottom-left, containing:
- Standard MHA (blue solid line)
- LRKV (r=16) (orange dashed line)
- LRKV (r=64) (green dotted line)
- MQA (red dotted line)
- MLA (purple dash-dot line)
- GQA (brown dashed line)
**Right Graph (PCA-based):**
- **X-axis (Layer):** Integer values 0-10
- **Y-axis (Effective Rank (PCA)):** Continuous scale 4.0-5.0
- **Legend:** Identical to left graph, with same color coding
### Detailed Analysis
**Left Graph Trends:**
1. **Standard MHA (blue):** Starts at 3.6 (layer 0), peaks at 5.9 (layer 1), then declines to 5.5 (layer 10)
2. **LRKV (r=16) (orange):** Begins at 2.0 (layer 0), rises sharply to 5.8 (layer 1), then fluctuates between 5.5-5.8
3. **LRKV (r=64) (green):** Maintains near-constant 6.0 across all layers
4. **MQA (red):** Shows volatile pattern: 2.0 → 5.7 → 4.5 → 3.0 → 3.2
5. **MLA (purple):** Starts at 4.8, peaks at 5.7 (layer 1), then declines to 4.3 (layer 10)
6. **GQA (brown):** Begins at 3.3, rises to 5.7 (layer 1), then fluctuates between 5.3-5.6
**Right Graph Trends:**
1. **Standard MHA (blue):** Starts at 4.7, peaks at 4.9 (layer 1), then declines to 4.8 (layer 10)
2. **LRKV (r=16) (orange):** Begins at 4.8, rises to 4.95 (layer 1), then fluctuates between 4.85-4.95
3. **LRKV (r=64) (green):** Maintains near-constant 4.98 across all layers
4. **MQA (red):** Shows dramatic drop: 4.7 → 4.9 → 4.8 → 4.1 → 4.3
5. **MLA (purple):** Starts at 4.7, peaks at 4.9 (layer 1), then declines to 4.6 (layer 10)
6. **GQA (brown):** Begins at 4.4, rises to 4.9 (layer 1), then fluctuates between 4.8-4.9
### Key Observations
1. **Dimensionality Reduction Effect:** PCA-based graph shows consistently lower effective ranks (4.0-5.0 vs 2.0-6.0 in original)
2. **Method Stability:** LRKV (r=64) maintains highest rank in both graphs, suggesting robustness
3. **MQA Anomaly:** Shows significant drop at layer 4 in original graph (3.0 vs 4.1 in PCA)
4. **Layer Sensitivity:** All methods show most dramatic changes between layers 0-2
5. **Normalization Impact:** PCA-based graph compresses rank values by ~20% compared to original
### Interpretation
The data demonstrates that PCA-based processing reduces effective rank across all methods while preserving relative performance patterns. LRKV (r=64) consistently achieves highest ranks, suggesting it maintains more information. The MQA method's anomalous drop at layer 4 in the original graph may indicate layer-specific vulnerabilities. The PCA transformation appears to normalize rank distributions, potentially improving interpretability while sacrificing some absolute rank values. These findings suggest PCA-based approaches could be valuable for analyzing attention mechanisms in transformer models, particularly when comparing different architectural choices.