## Line Chart: Run Family Accuracy vs. Training Steps
### Overview
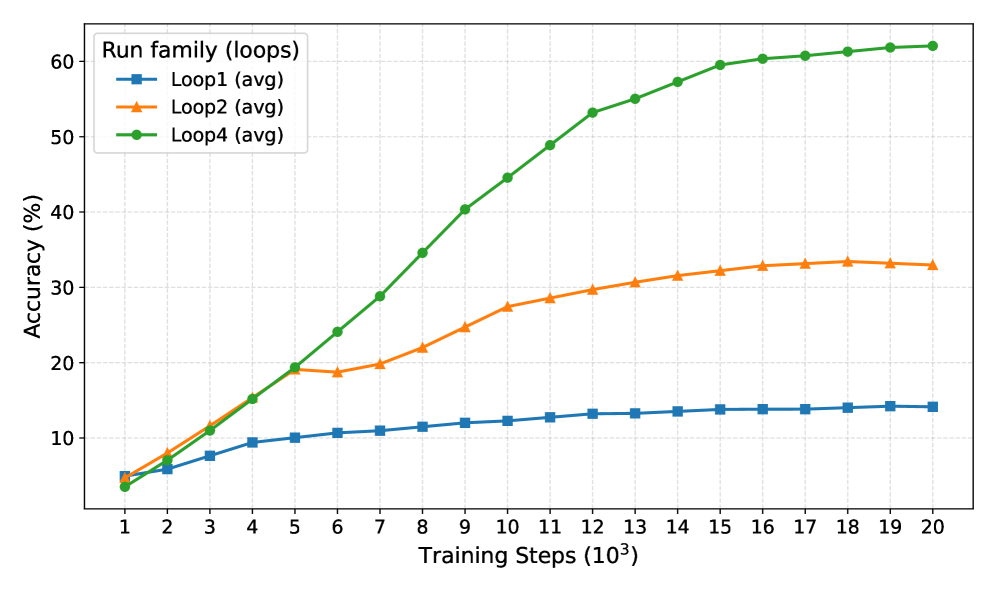
The image is a line chart comparing the accuracy of three different "Run family (loops)" configurations (Loop1, Loop2, and Loop4) as a function of training steps. The x-axis represents training steps in thousands (10^3), ranging from 1 to 20. The y-axis represents accuracy in percentage (%), ranging from 0 to 60.
### Components/Axes
* **Title:** Run family (loops)
* **X-axis:** Training Steps (10^3), with markers at each integer value from 1 to 20.
* **Y-axis:** Accuracy (%), with markers at intervals of 10 from 0 to 60.
* **Legend:** Located in the top-left corner of the chart.
* Loop1 (avg) - Blue line with square markers
* Loop2 (avg) - Orange line with triangle markers
* Loop4 (avg) - Green line with circle markers
### Detailed Analysis
* **Loop1 (avg):** (Blue line with square markers)
* Trend: The accuracy increases slightly with training steps and then plateaus.
* Data Points:
* At 1k training steps, accuracy is approximately 4%.
* At 5k training steps, accuracy is approximately 11%.
* At 10k training steps, accuracy is approximately 13%.
* At 20k training steps, accuracy is approximately 14%.
* **Loop2 (avg):** (Orange line with triangle markers)
* Trend: The accuracy increases with training steps, plateaus, and then slightly decreases.
* Data Points:
* At 1k training steps, accuracy is approximately 4%.
* At 5k training steps, accuracy is approximately 15%.
* At 10k training steps, accuracy is approximately 28%.
* At 17k training steps, accuracy is approximately 33%.
* At 20k training steps, accuracy is approximately 32%.
* **Loop4 (avg):** (Green line with circle markers)
* Trend: The accuracy increases rapidly with training steps and then plateaus.
* Data Points:
* At 1k training steps, accuracy is approximately 3%.
* At 5k training steps, accuracy is approximately 22%.
* At 10k training steps, accuracy is approximately 49%.
* At 15k training steps, accuracy is approximately 59%.
* At 20k training steps, accuracy is approximately 62%.
### Key Observations
* Loop4 consistently outperforms Loop1 and Loop2 in terms of accuracy across all training steps.
* Loop1 has the lowest accuracy and plateaus early in the training process.
* Loop2 shows a moderate increase in accuracy but plateaus and slightly decreases towards the end of the training steps.
* Loop4 shows the most significant improvement in accuracy with training steps, reaching the highest accuracy among the three loops.
### Interpretation
The chart demonstrates the impact of different loop configurations on the accuracy of a model during training. Loop4 appears to be the most effective configuration, achieving the highest accuracy and showing a strong positive correlation with training steps. Loop1 is the least effective, showing minimal improvement with increased training. Loop2 shows some improvement but plateaus and slightly declines, suggesting it may not be as robust as Loop4. The data suggests that the choice of loop configuration significantly affects the model's performance, and Loop4 is the preferred option based on the observed accuracy.