## Vector Field Diagram: 3D Vector Field Visualization
### Overview
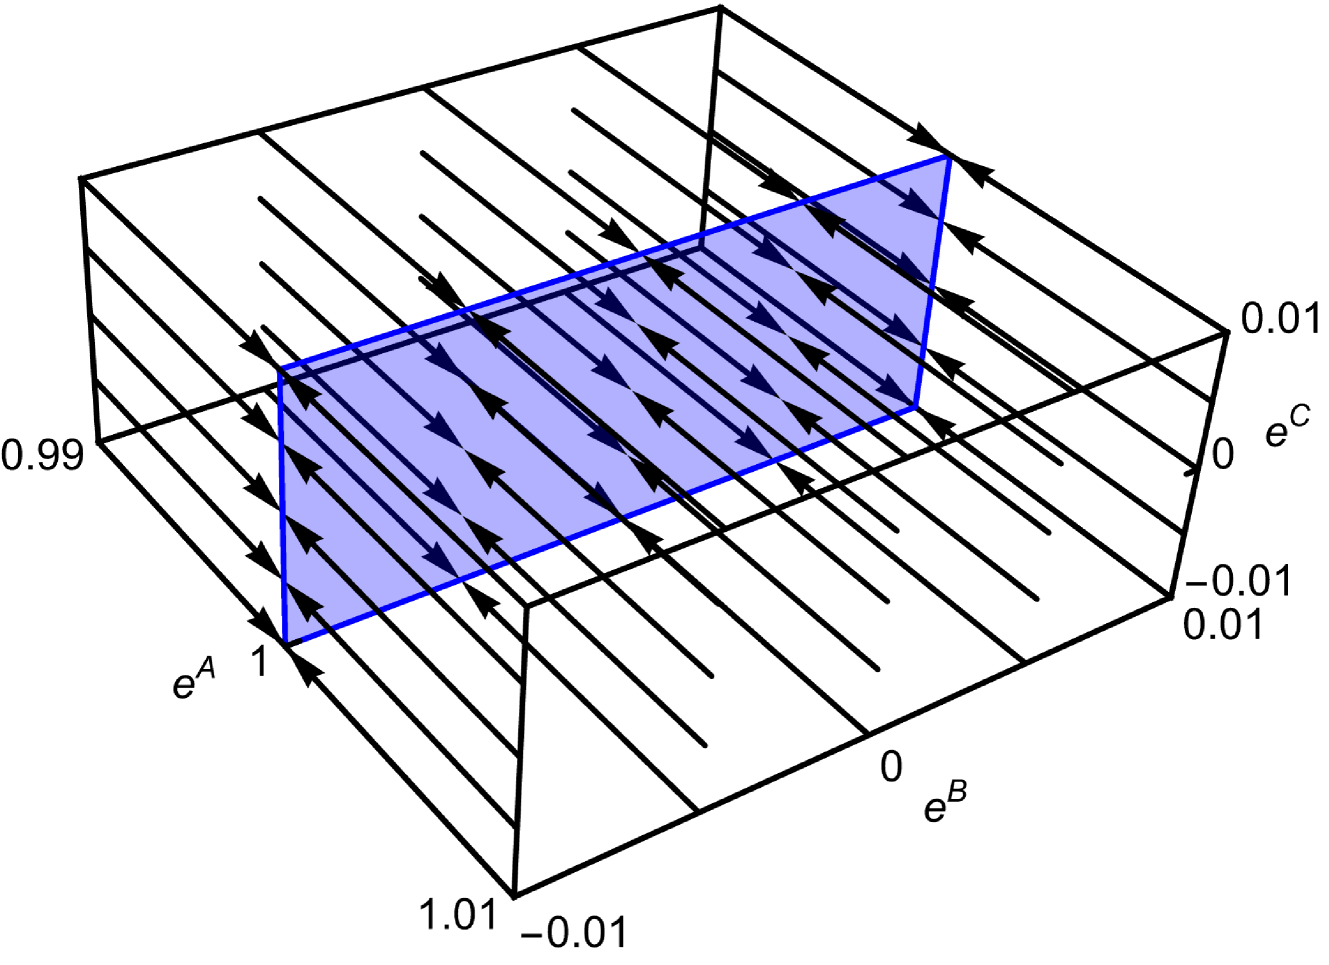
The image is a 3D vector field diagram within a rectangular prism. The diagram visualizes a vector field using black arrows, with a blue rectangular plane intersecting the field. The axes are labeled as eA, eB, and eC.
### Components/Axes
* **Axes:**
* eA: Vertical axis, ranging from 0.99 to 1.01, with a marked value at 1.
* eB: Horizontal axis, ranging from -0.01 to 0.01, with a marked value at 0.
* eC: Depth axis, ranging from -0.01 to 0.01, with marked values at -0.01, 0, and 0.01.
* **Vector Field:** Represented by black arrows indicating direction and magnitude.
* **Blue Plane:** A rectangular plane colored blue, intersecting the vector field. The plane is outlined in blue.
### Detailed Analysis or Content Details
* **Vector Field Arrows:** The black arrows appear to be generally aligned, flowing from the top-left towards the bottom-right of the prism.
* **Blue Plane Vectors:** The arrows on the blue plane are oriented in a consistent direction, generally pointing downwards and slightly to the right.
* **Axis Values:**
* eA: 0.99, 1, 1.01
* eB: -0.01, 0, 0.01
* eC: -0.01, 0, 0.01
### Key Observations
* The vector field appears relatively uniform outside the blue plane.
* The vectors on the blue plane show a consistent direction, suggesting a specific flow pattern within that region.
* The axes provide a coordinate system for understanding the spatial distribution of the vector field.
### Interpretation
The diagram visualizes a 3D vector field and its interaction with a specific plane. The consistent direction of vectors on the blue plane suggests a defined flow or force acting within that region. The axes provide a reference frame for quantifying the vector field's behavior in 3D space. The diagram could represent a physical phenomenon, such as fluid flow or electromagnetic field, where the blue plane represents a boundary or interface.