## Line Chart: Rainfall Prediction Comparison
### Overview
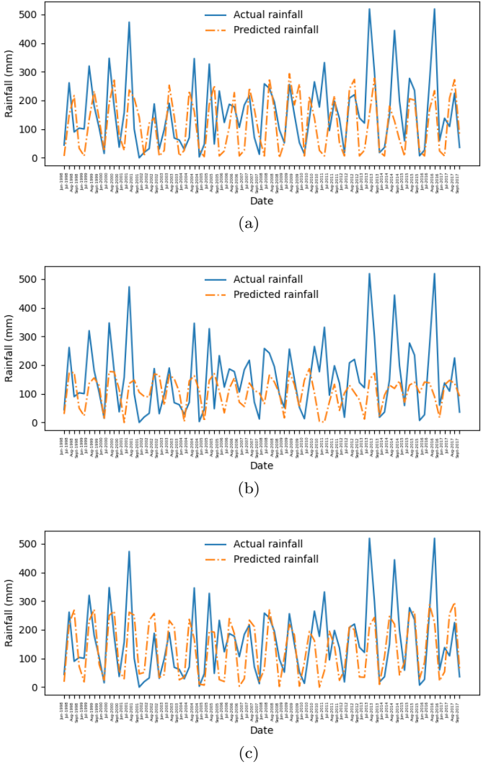
The image presents three line charts (labeled a, b, and c) comparing actual rainfall to predicted rainfall over time. Each chart displays rainfall in millimeters (mm) on the y-axis against date on the x-axis. The charts appear to be evaluating the performance of a rainfall prediction model.
### Components/Axes
* **X-axis:** Labeled "Date". The dates are not fully legible, but appear to span approximately 2 years, with tick marks indicating monthly intervals. The dates are displayed in a format resembling "YYYY-MM".
* **Y-axis:** Labeled "Rainfall (mm)". The scale ranges from 0 to 500 mm, with tick marks at 100 mm intervals.
* **Legend:** Located in the top-left corner of each chart.
* "Actual rainfall" - Represented by a solid blue line.
* "Predicted rainfall" - Represented by a dashed orange line.
* **Chart Labels:** Each chart is labeled (a), (b), and (c) at the bottom-center.
### Detailed Analysis or Content Details
**Chart (a):**
* **Actual Rainfall (Blue Line):** The line exhibits a clear seasonal pattern with peaks around the middle of the year and troughs at the beginning and end. The line fluctuates between approximately 0 mm and 450 mm.
* Approximate data points (visually estimated):
* Start (approx. 2019-01): ~50 mm
* Peak 1 (approx. 2019-06): ~400 mm
* Trough 1 (approx. 2019-12): ~20 mm
* Peak 2 (approx. 2020-06): ~420 mm
* End (approx. 2020-12): ~30 mm
* **Predicted Rainfall (Orange Dashed Line):** The predicted rainfall generally follows the same seasonal pattern as the actual rainfall, but with some discrepancies in magnitude. The line fluctuates between approximately 0 mm and 480 mm.
* Approximate data points (visually estimated):
* Start (approx. 2019-01): ~40 mm
* Peak 1 (approx. 2019-06): ~380 mm
* Trough 1 (approx. 2019-12): ~10 mm
* Peak 2 (approx. 2020-06): ~400 mm
* End (approx. 2020-12): ~20 mm
**Chart (b):**
* **Actual Rainfall (Blue Line):** Similar seasonal pattern to chart (a), but with more pronounced peaks and troughs. Fluctuates between approximately 0 mm and 500 mm.
* Approximate data points (visually estimated):
* Start (approx. 2019-01): ~30 mm
* Peak 1 (approx. 2019-06): ~450 mm
* Trough 1 (approx. 2019-12): ~0 mm
* Peak 2 (approx. 2020-06): ~480 mm
* End (approx. 2020-12): ~10 mm
* **Predicted Rainfall (Orange Dashed Line):** Follows the seasonal pattern, but with more significant deviations from the actual rainfall, particularly during peak periods. Fluctuates between approximately 0 mm and 450 mm.
* Approximate data points (visually estimated):
* Start (approx. 2019-01): ~20 mm
* Peak 1 (approx. 2019-06): ~400 mm
* Trough 1 (approx. 2019-12): ~5 mm
* Peak 2 (approx. 2020-06): ~420 mm
* End (approx. 2020-12): ~5 mm
**Chart (c):**
* **Actual Rainfall (Blue Line):** Again, a seasonal pattern is visible, with peaks around the middle of the year. Fluctuates between approximately 0 mm and 450 mm.
* Approximate data points (visually estimated):
* Start (approx. 2019-01): ~40 mm
* Peak 1 (approx. 2019-06): ~420 mm
* Trough 1 (approx. 2019-12): ~15 mm
* Peak 2 (approx. 2020-06): ~440 mm
* End (approx. 2020-12): ~25 mm
* **Predicted Rainfall (Orange Dashed Line):** The predicted rainfall closely mirrors the actual rainfall in this chart, with relatively small discrepancies. Fluctuates between approximately 0 mm and 460 mm.
* Approximate data points (visually estimated):
* Start (approx. 2019-01): ~35 mm
* Peak 1 (approx. 2019-06): ~400 mm
* Trough 1 (approx. 2019-12): ~10 mm
* Peak 2 (approx. 2020-06): ~420 mm
* End (approx. 2020-12): ~20 mm
### Key Observations
* All three charts demonstrate a clear seasonal pattern in rainfall.
* Chart (c) shows the closest alignment between predicted and actual rainfall.
* Chart (b) exhibits the largest discrepancies between predicted and actual rainfall, particularly during peak rainfall events.
* The predicted rainfall consistently underestimates the peak rainfall amounts in charts (a) and (b).
### Interpretation
The charts compare the performance of a rainfall prediction model across three different scenarios (a, b, and c). The consistent seasonal pattern in actual rainfall suggests a strong climatic influence. The varying degrees of accuracy in the predictions indicate that the model's performance is sensitive to certain conditions or data inputs. Chart (c) suggests a scenario where the model performs optimally, while chart (b) represents a scenario where the model struggles to accurately predict rainfall, especially during periods of high precipitation. The consistent underestimation of peak rainfall in charts (a) and (b) suggests a potential bias in the model or a limitation in its ability to capture extreme rainfall events. Further investigation would be needed to determine the factors contributing to these differences in performance and to improve the model's accuracy. The data suggests that the model is more accurate in some conditions than others, and that further refinement is needed to improve its overall predictive capability.