## Chart Type: Receiver Operating Characteristic (ROC) Curves
### Overview
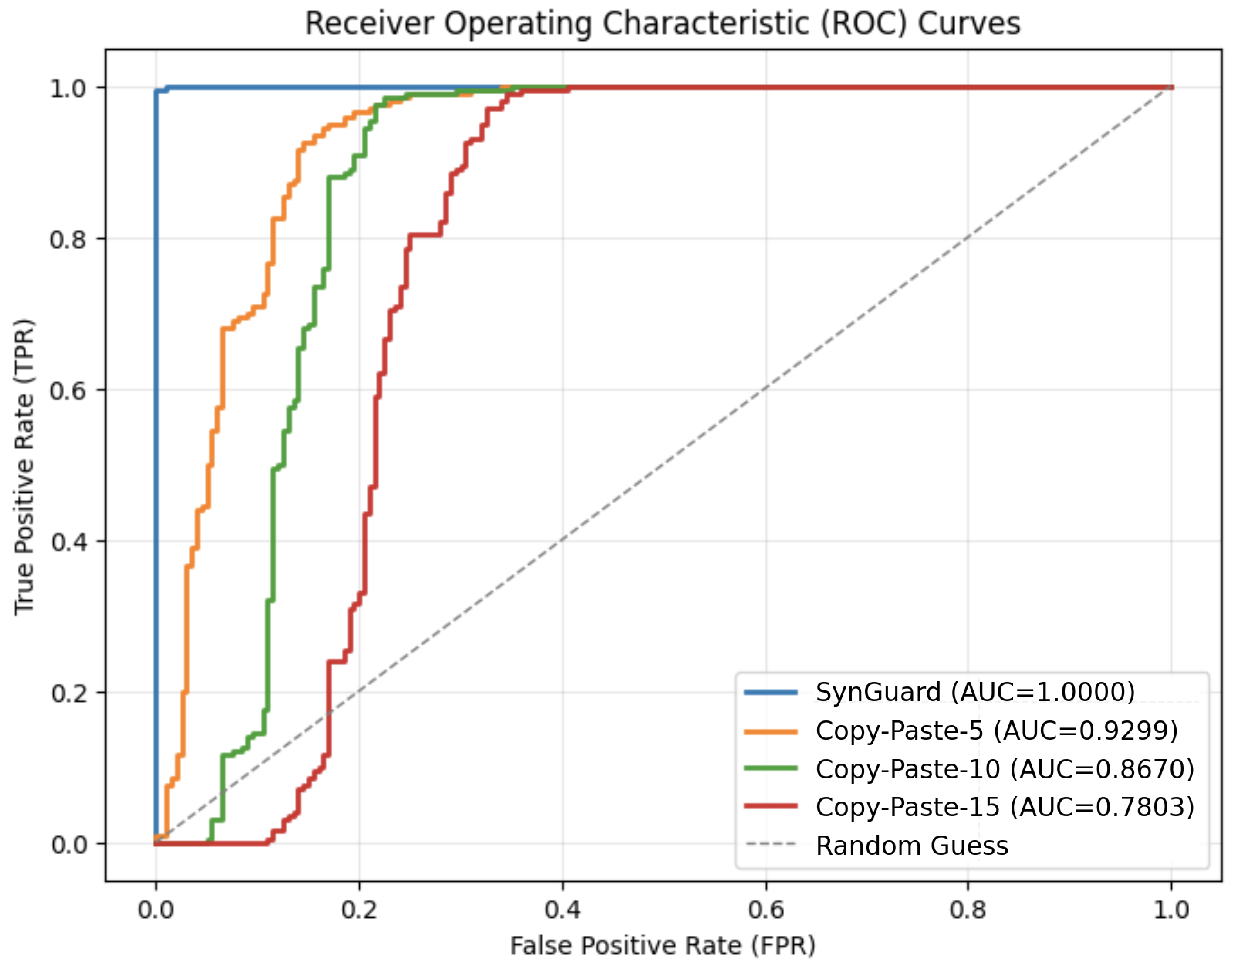
The image is a Receiver Operating Characteristic (ROC) curve chart comparing the performance of different methods: SynGuard, Copy-Paste-5, Copy-Paste-10, and Copy-Paste-15, along with a random guess baseline. The chart plots the True Positive Rate (TPR) against the False Positive Rate (FPR). The Area Under the Curve (AUC) is provided for each method.
### Components/Axes
* **Title:** Receiver Operating Characteristic (ROC) Curves
* **X-axis:** False Positive Rate (FPR), ranging from 0.0 to 1.0 in increments of 0.2.
* **Y-axis:** True Positive Rate (TPR), ranging from 0.0 to 1.0 in increments of 0.2.
* **Legend:** Located in the bottom-right corner, it identifies each line by name and AUC score:
* SynGuard (AUC=1.0000) - Blue line
* Copy-Paste-5 (AUC=0.9299) - Orange line
* Copy-Paste-10 (AUC=0.8670) - Green line
* Copy-Paste-15 (AUC=0.7803) - Red line
* Random Guess - Dashed gray line
### Detailed Analysis
* **SynGuard (Blue):** The blue line rises vertically at FPR=0.0 to TPR=1.0, then remains at TPR=1.0 for all FPR values. This indicates perfect classification performance.
* **Copy-Paste-5 (Orange):** The orange line rises sharply from (0.0, 0.0) to approximately (0.0, 0.68), then gradually increases to TPR=1.0 as FPR increases to approximately 0.2.
* **Copy-Paste-10 (Green):** The green line rises from (0.0, 0.0) to approximately (0.1, 0.9), then gradually increases to TPR=1.0 as FPR increases to approximately 0.3.
* **Copy-Paste-15 (Red):** The red line rises from (0.0, 0.0) to approximately (0.2, 0.9), then gradually increases to TPR=1.0 as FPR increases to approximately 0.4.
* **Random Guess (Dashed Gray):** The dashed gray line represents a diagonal line from (0.0, 0.0) to (1.0, 1.0), indicating random classification performance.
### Key Observations
* SynGuard has the highest AUC (1.0000), indicating perfect classification.
* The AUC values decrease from Copy-Paste-5 to Copy-Paste-10 to Copy-Paste-15, indicating a decline in performance.
* The Random Guess line serves as a baseline for comparison.
### Interpretation
The ROC curves illustrate the performance of different methods in distinguishing between positive and negative cases. SynGuard demonstrates perfect classification, while the Copy-Paste methods show varying degrees of effectiveness, with performance decreasing as the number increases (5, 10, 15). The Random Guess line represents the performance expected by chance. The further a curve is from the Random Guess line and the closer it is to the top-left corner, the better the classification performance.