## ROC Curves: Receiver Operating Characteristic (ROC) Curves
### Overview
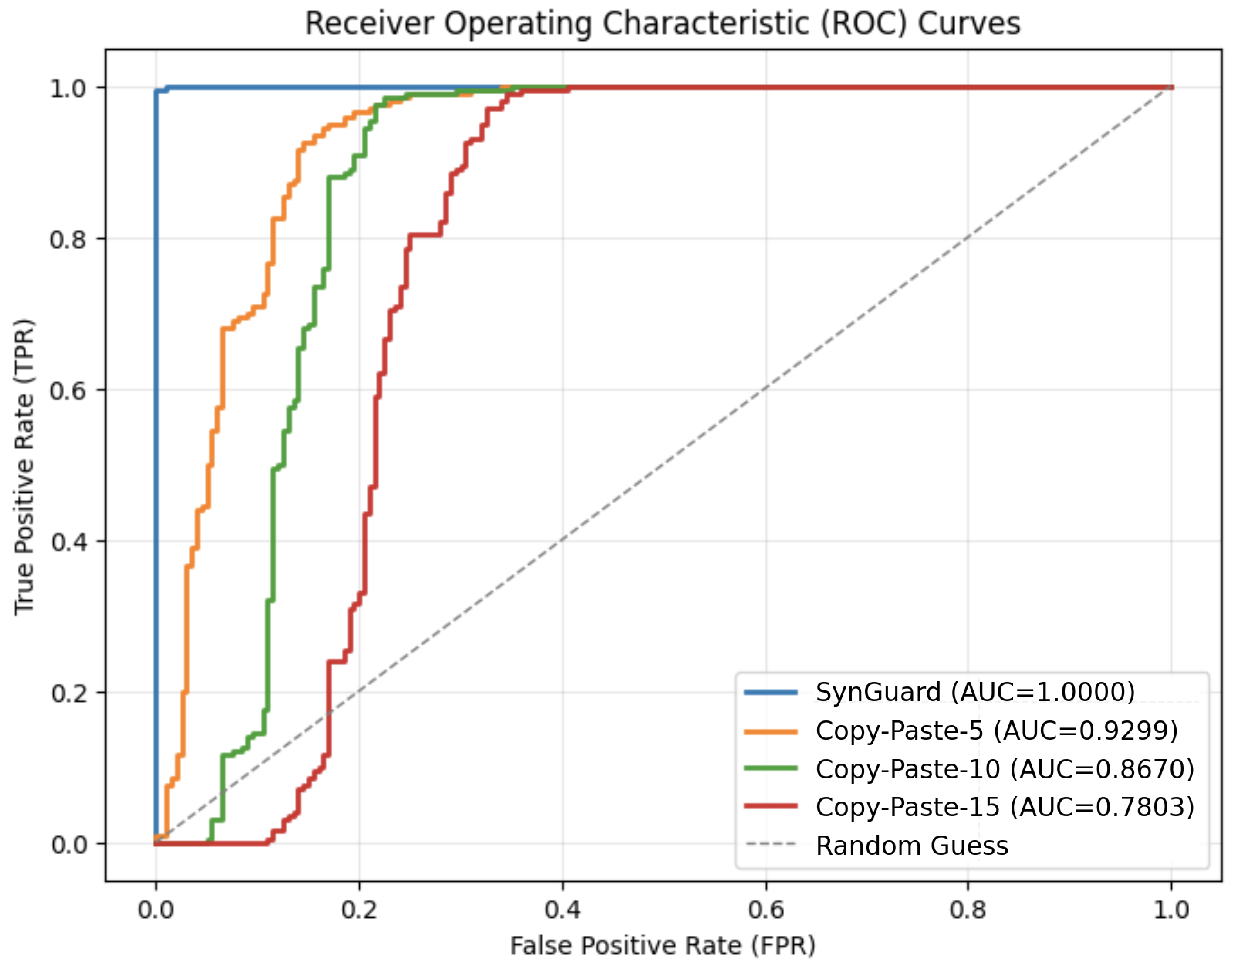
The image displays a Receiver Operating Characteristic (ROC) curve chart comparing the performance of four classification models: **SynGuard**, **Copy-Paste-5**, **Copy-Paste-10**, **Copy-Paste-15**, and a **Random Guess** baseline. The chart plots **True Positive Rate (TPR)** against **False Positive Rate (FPR)**, with each model represented by a distinct colored line. The **Random Guess** line is a dashed diagonal reference.
---
### Components/Axes
- **X-axis**: **False Positive Rate (FPR)** (0.0 to 1.0, increments of 0.2).
- **Y-axis**: **True Positive Rate (TPR)** (0.0 to 1.0, increments of 0.2).
- **Legend**: Located in the **bottom-right corner**, with the following entries:
- **SynGuard** (blue line, AUC = 1.0000)
- **Copy-Paste-5** (orange line, AUC = 0.9299)
- **Copy-Paste-10** (green line, AUC = 0.8670)
- **Copy-Paste-15** (red line, AUC = 0.7803)
- **Random Guess** (dashed gray line).
---
### Detailed Analysis
1. **SynGuard (Blue Line)**:
- Starts at (0.0, 0.0) and immediately rises vertically to (0.0, 1.0), then horizontally to (1.0, 1.0).
- **Trend**: Perfect classifier (TPR = 1.0 for all FPR values).
- **AUC**: 1.0000 (maximum possible).
2. **Copy-Paste-5 (Orange Line)**:
- Starts at (0.0, 0.0) and rises steeply to (0.2, 0.8), then gradually increases to (1.0, 1.0).
- **Trend**: High TPR at low FPR, but performance degrades slightly at higher FPR.
- **AUC**: 0.9299.
3. **Copy-Paste-10 (Green Line)**:
- Starts at (0.0, 0.0) and rises to (0.2, 0.6), then gradually increases to (1.0, 1.0).
- **Trend**: Lower TPR than Copy-Paste-5 at low FPR, with a more gradual slope.
- **AUC**: 0.8670.
4. **Copy-Paste-15 (Red Line)**:
- Starts at (0.0, 0.0) and rises to (0.2, 0.4), then gradually increases to (1.0, 1.0).
- **Trend**: Lowest TPR among the Copy-Paste models at low FPR, with the flattest slope.
- **AUC**: 0.7803.
5. **Random Guess (Dashed Gray Line)**:
- Diagonal line from (0.0, 0.0) to (1.0, 1.0).
- **Trend**: Represents a baseline performance (no discrimination).
---
### Key Observations
- **SynGuard** outperforms all other models, achieving a perfect AUC of 1.0000.
- **Copy-Paste-5** is the second-best model, with an AUC of 0.9299, followed by **Copy-Paste-10** (0.8670) and **Copy-Paste-15** (0.7803).
- The **Random Guess** line serves as a reference, showing that all models perform better than random chance.
- The **Copy-Paste** models exhibit a trade-off between TPR and FPR, with higher numbers (e.g., 15) resulting in lower AUC values.
---
### Interpretation
The chart demonstrates that **SynGuard** is the most effective classifier, achieving perfect discrimination (TPR = 1.0 for all FPR values). The **Copy-Paste** models show diminishing performance as the number increases (5 → 10 → 15), likely due to increased complexity or noise in the data. The **Random Guess** line confirms that all models outperform a baseline of random classification. The AUC values quantitatively validate these trends, with higher values indicating better model performance. The step-like progression of the Copy-Paste curves suggests they may be using threshold-based decision rules, while SynGuard’s vertical rise implies a deterministic or highly optimized classification mechanism.