## Chart Type: Horizontal Bar Chart
### Overview
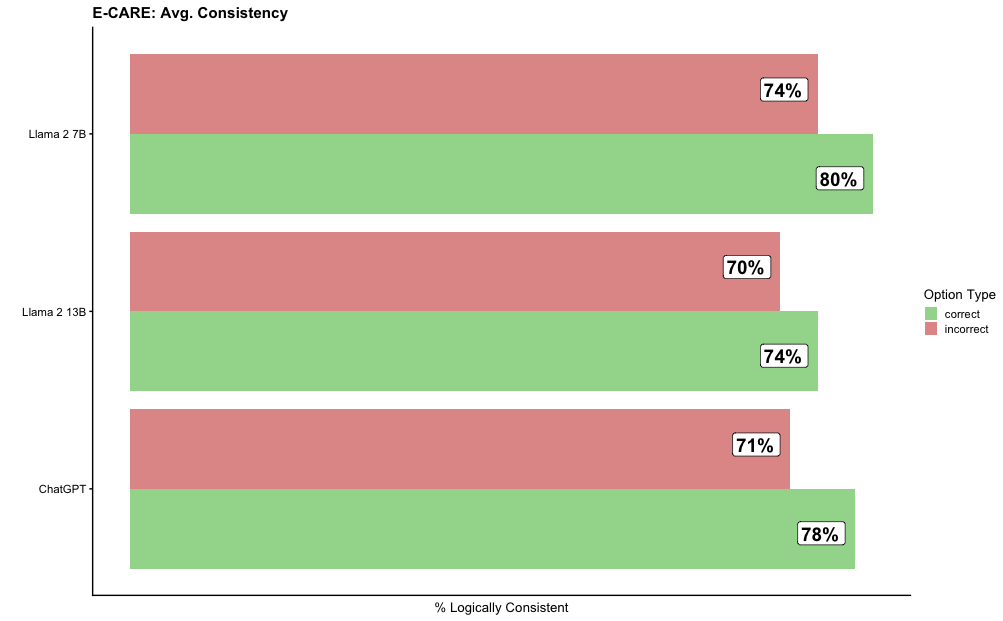
The image is a horizontal bar chart comparing the average consistency of three language models (Llama 2 7B, Llama 2 13B, and ChatGPT) on the E-CARE benchmark. The chart displays the percentage of logically consistent responses, broken down into "correct" and "incorrect" option types.
### Components/Axes
* **Title:** E-CARE: Avg. Consistency
* **Y-axis:** Language Models (Llama 2 7B, Llama 2 13B, ChatGPT)
* **X-axis:** % Logically Consistent
* **Legend (top-right):**
* Green: correct
* Red: incorrect
### Detailed Analysis
The chart presents the percentage of logically consistent responses for each language model, separated by whether the response was "correct" or "incorrect".
* **Llama 2 7B:**
* Correct: 80%
* Incorrect: 74%
* **Llama 2 13B:**
* Correct: 74%
* Incorrect: 70%
* **ChatGPT:**
* Correct: 78%
* Incorrect: 71%
### Key Observations
* For all three models, the percentage of "correct" logically consistent responses is higher than the percentage of "incorrect" logically consistent responses.
* Llama 2 7B has the highest percentage of "correct" logically consistent responses (80%).
* Llama 2 13B has the lowest percentage of "incorrect" logically consistent responses (70%).
### Interpretation
The chart suggests that all three language models exhibit a reasonable level of logical consistency on the E-CARE benchmark. However, there are differences in performance between the models. Llama 2 7B appears to be the most consistent in providing correct and logically consistent responses, while Llama 2 13B shows the lowest percentage of incorrect but logically consistent responses. ChatGPT falls in between the two Llama models in terms of both correct and incorrect logically consistent responses. The data indicates that while the models are generally consistent, there is still room for improvement, particularly in reducing the number of incorrect responses that are still logically consistent.