\n
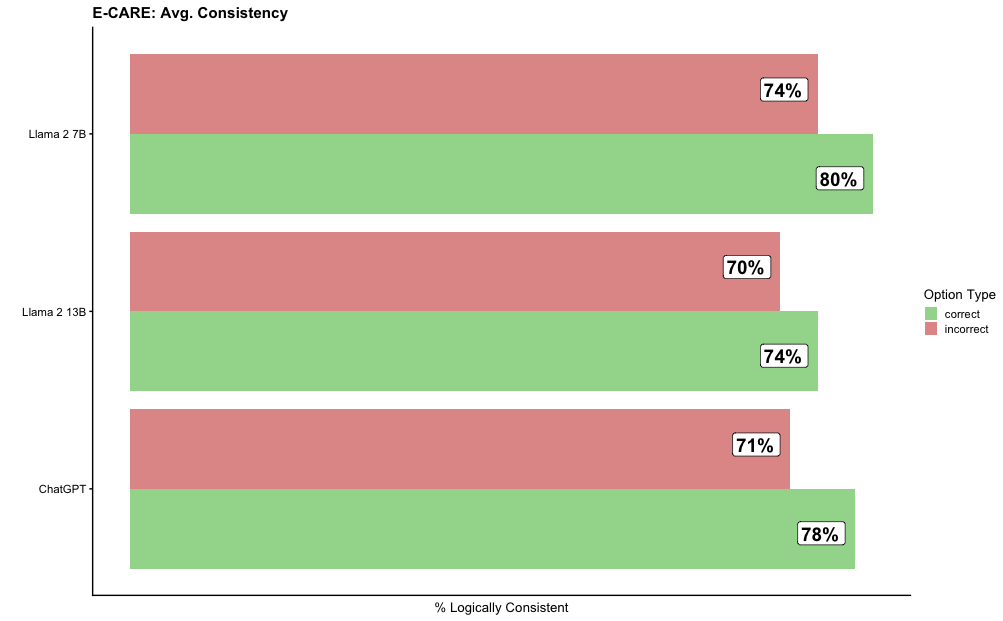
## Horizontal Bar Chart: E-CARE Avg. Consistency
### Overview
This is a horizontal bar chart comparing the percentage of logically consistent responses (both correct and incorrect) from three different models: Chat-1, Llama 2 13B, and Llama 2 7B. The chart displays the average consistency for each model, broken down by whether the response was "correct" or "incorrect".
### Components/Axes
* **Title:** E-CARE: Avg. Consistency (top-center)
* **X-axis:** % Logically Consistent (bottom)
* **Y-axis:** Model Names (left): Chat-1, Llama 2 13B, Llama 2 7B
* **Legend:** Located in the top-right corner.
* "correct" - represented by a green color.
* "incorrect" - represented by a red color.
### Detailed Analysis
The chart consists of six horizontal bars, two for each model. Each pair represents the percentage of "correct" and "incorrect" responses.
* **Chat-1:**
* Correct: Approximately 78% (bar extends to around the 78% mark on the x-axis).
* Incorrect: Approximately 71% (bar extends to around the 71% mark on the x-axis).
* **Llama 2 13B:**
* Correct: Approximately 74% (bar extends to around the 74% mark on the x-axis).
* Incorrect: Approximately 70% (bar extends to around the 70% mark on the x-axis).
* **Llama 2 7B:**
* Correct: Approximately 80% (bar extends to around the 80% mark on the x-axis).
* Incorrect: Approximately 74% (bar extends to around the 74% mark on the x-axis).
### Key Observations
* Llama 2 7B has the highest percentage of correct responses (80%), while Chat-1 has the highest percentage of incorrect responses (71%).
* Llama 2 7B consistently outperforms the other two models in terms of logical consistency for correct responses.
* The difference between correct and incorrect responses is relatively small for all three models, suggesting that all models sometimes produce logically inconsistent outputs.
### Interpretation
The data suggests that Llama 2 7B is the most logically consistent model among the three tested, particularly when generating correct responses. The relatively close values for correct and incorrect responses across all models indicate that logical consistency is a challenge for all of them. The chart highlights the importance of evaluating not only the correctness of model outputs but also their logical coherence. The E-CARE metric appears to be measuring the logical soundness of the responses, and this chart provides a comparative view of three models on this metric. The fact that incorrect responses are also assigned a consistency score suggests that the metric is evaluating the internal logic of the response, even if the response is factually wrong. This could be useful for identifying models that generate confidently incorrect but logically structured responses versus those that generate random or incoherent outputs.