# Technical Document Extraction: Heatmap Analysis of Expert Load Distribution
## **Axes and Labels**
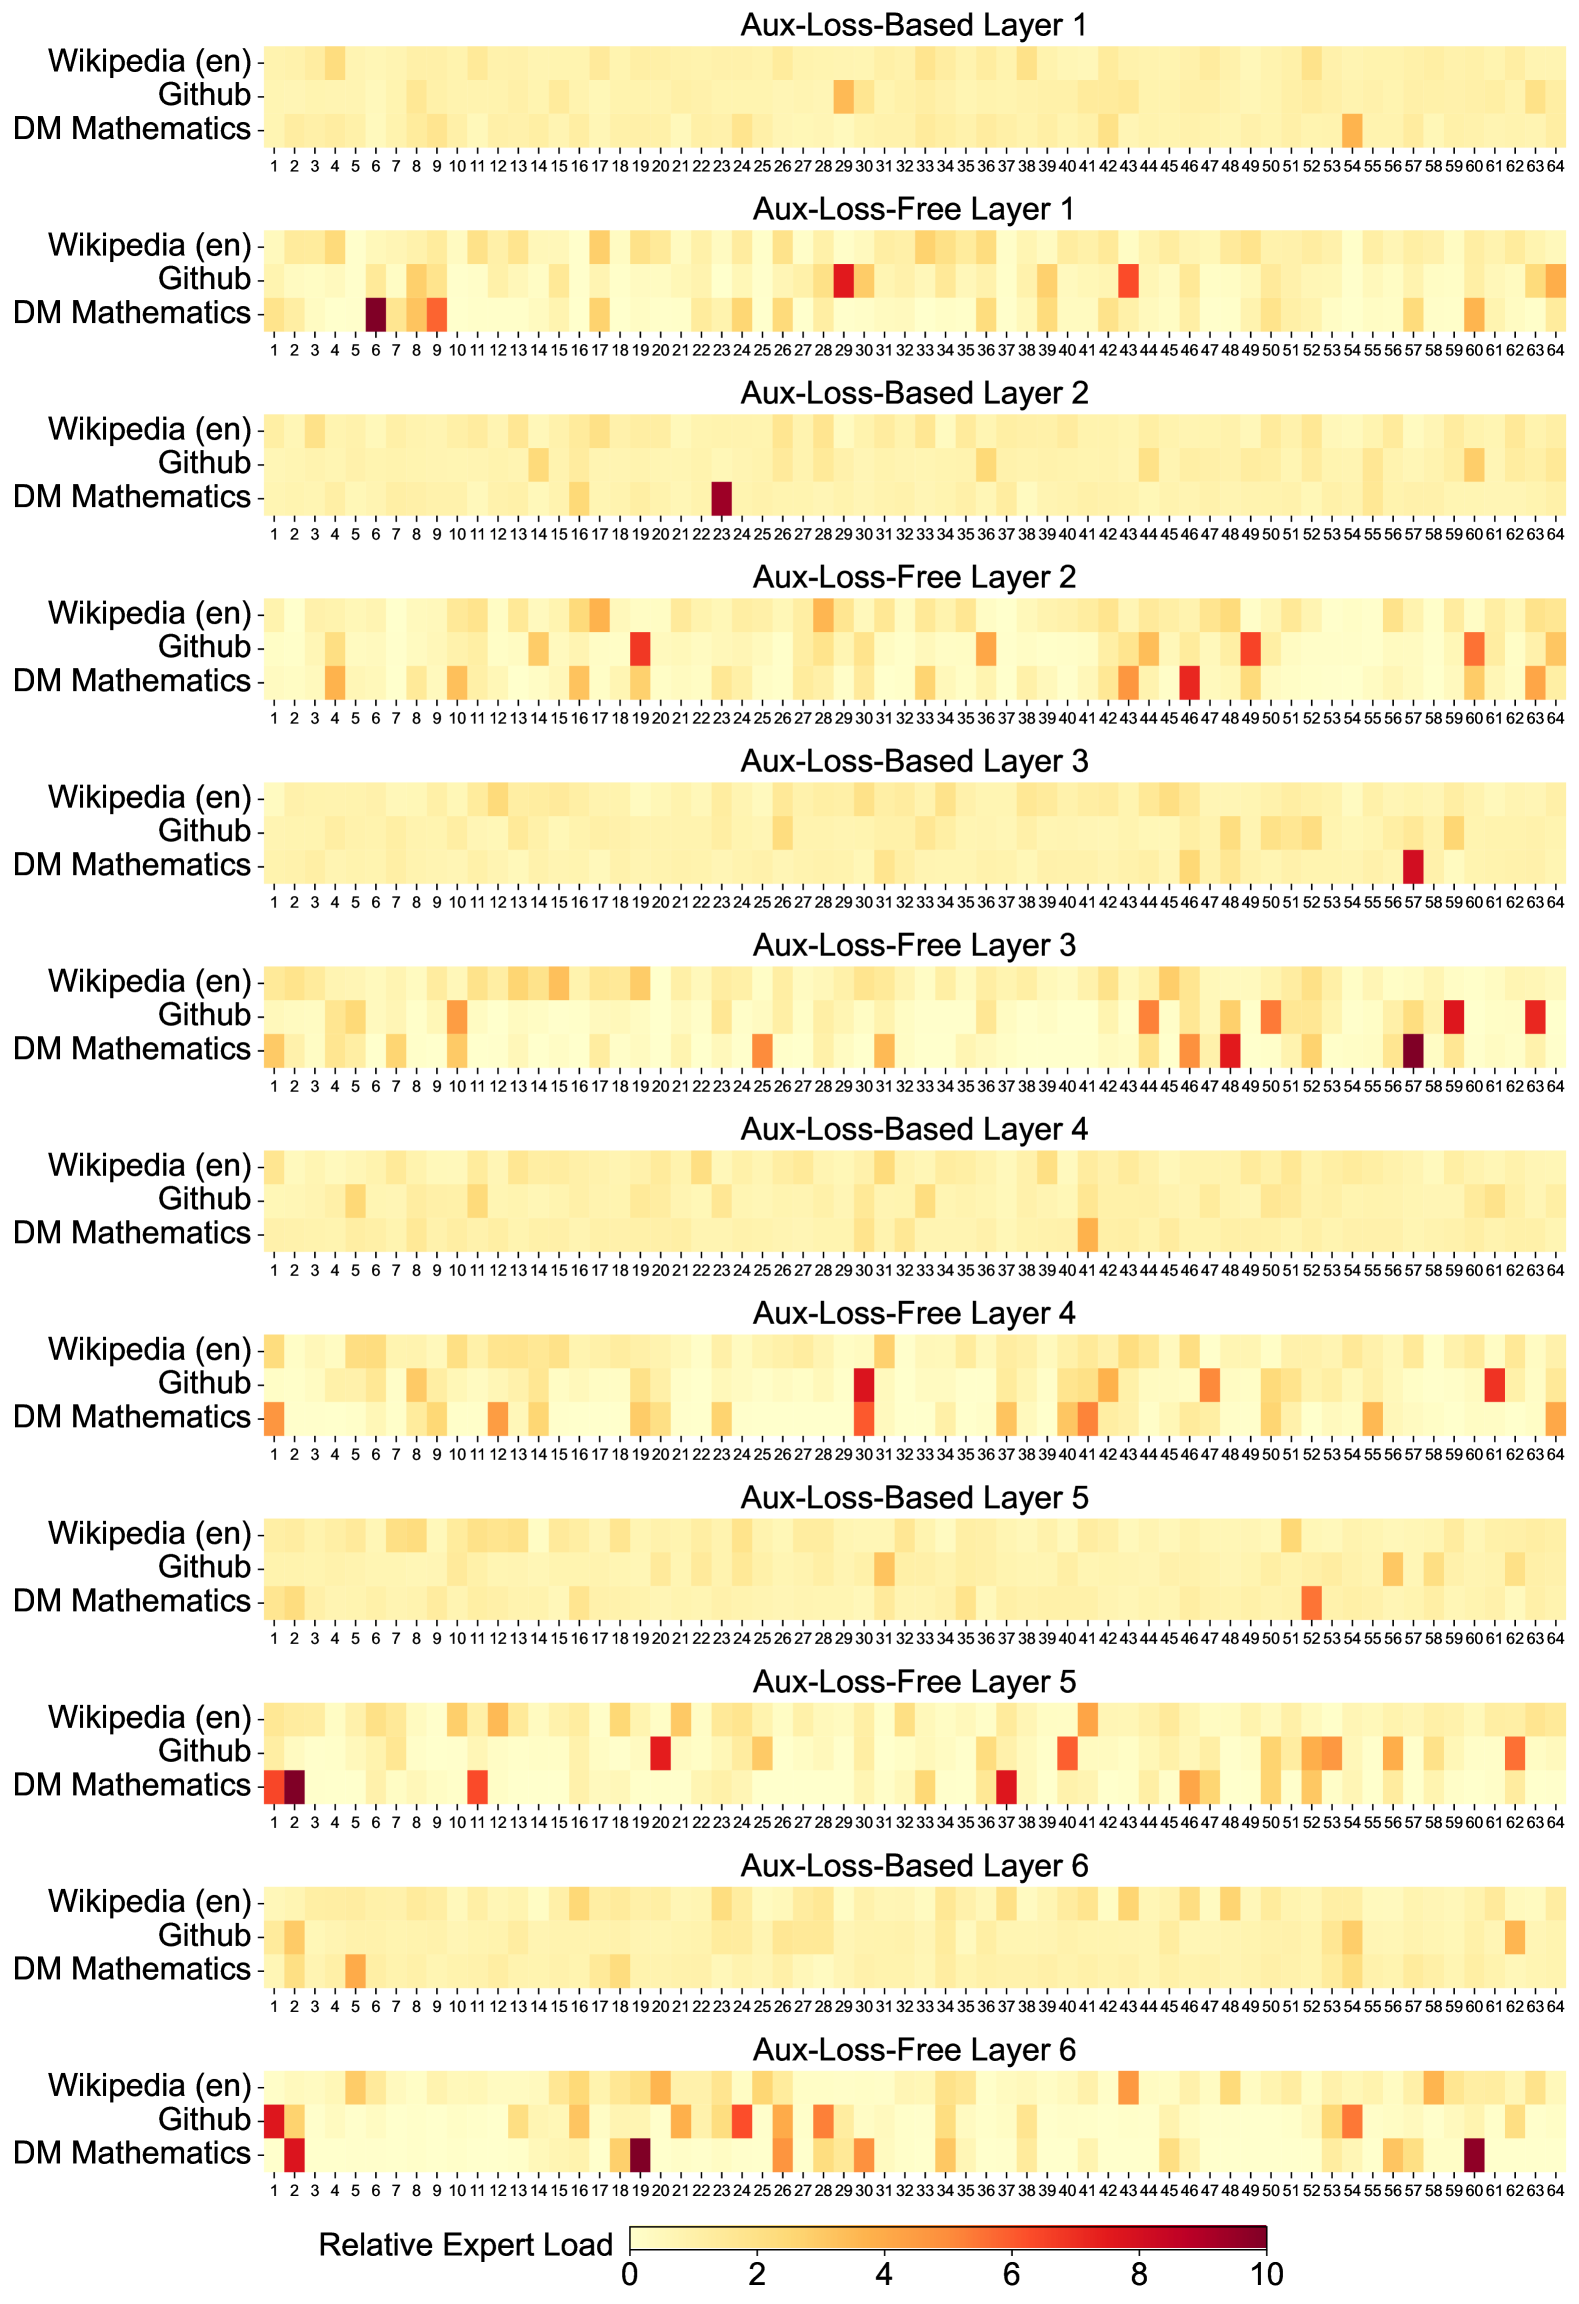
- **X-Axis**: "Relative Expert Load" with numerical markers: `0, 2, 4, 6, 8, 10`.
- **Y-Axis**: Datasets listed in order:
- `Wikipedia (en)`
- `GitHub`
- `DM Mathematics`
- **Legend**: Located at the bottom of the image, representing a color scale from `0` (light yellow) to `10` (dark red).
---
## **Layer Structure**
The image contains **12 heatmaps** organized into **6 pairs** of layers:
1. **Aux-Loss-Based Layer 1**
- **Aux-Loss-Free Layer 1**
2. **Aux-Loss-Based Layer 2**
- **Aux-Loss-Free Layer 2**
3. **Aux-Loss-Based Layer 3**
- **Aux-Loss-Free Layer 3**
4. **Aux-Loss-Based Layer 4**
- **Aux-Loss-Free Layer 4**
5. **Aux-Loss-Based Layer 5**
- **Aux-Loss-Free Layer 5**
6. **Aux-Loss-Based Layer 6**
- **Aux-Loss-Free Layer 6**
Each heatmap uses a **color gradient** to represent the relative expert load, with darker red indicating higher load and lighter yellow indicating lower load.
---
## **Key Trends and Data Points**
### **Aux-Loss-Based Layers**
- **Layer 1**:
- Dark red clusters observed in `Wikipedia (en)` and `DM Mathematics` at `x ≈ 6-8`.
- Light yellow dominates `GitHub` across the x-axis.
- **Layer 2**:
- Dark red peaks in `Wikipedia (en)` at `x ≈ 4-6` and `DM Mathematics` at `x ≈ 10`.
- `GitHub` shows moderate load (`x ≈ 2-4`).
- **Layer 3**:
- Dark red in `Wikipedia (en)` at `x ≈ 8-10` and `DM Mathematics` at `x ≈ 6`.
- `GitHub` has sparse dark red (`x ≈ 2`).
- **Layer 4**:
- Dark red in `Wikipedia (en)` at `x ≈ 4-6` and `DM Mathematics` at `x ≈ 10`.
- `GitHub` shows minimal load (`x ≈ 0-2`).
- **Layer 5**:
- Dark red in `Wikipedia (en)` at `x ≈ 6-8` and `DM Mathematics` at `x ≈ 4`.
- `GitHub` has moderate load (`x ≈ 2-4`).
- **Layer 6**:
- Dark red in `Wikipedia (en)` at `x ≈ 2-4` and `DM Mathematics` at `x ≈ 10`.
- `GitHub` shows sparse load (`x ≈ 0-2`).
### **Aux-Loss-Free Layers**
- **Layer 1**:
- Dark red in `Wikipedia (en)` at `x ≈ 6-8` and `DM Mathematics` at `x ≈ 4`.
- `GitHub` has minimal load (`x ≈ 0-2`).
- **Layer 2**:
- Dark red in `Wikipedia (en)` at `x ≈ 4-6` and `DM Mathematics` at `x ≈ 10`.
- `GitHub` shows moderate load (`x ≈ 2-4`).
- **Layer 3**:
- Dark red in `Wikipedia (en)` at `x ≈ 8-10` and `DM Mathematics` at `x ≈ 6`.
- `GitHub` has sparse load (`x ≈ 2`).
- **Layer 4**:
- Dark red in `Wikipedia (en)` at `x ≈ 4-6` and `DM Mathematics` at `x ≈ 10`.
- `GitHub` shows minimal load (`x ≈ 0-2`).
- **Layer 5**:
- Dark red in `Wikipedia (en)` at `x ≈ 6-8` and `DM Mathematics` at `x ≈ 4`.
- `GitHub` has moderate load (`x ≈ 2-4`).
- **Layer 6**:
- Dark red in `Wikipedia (en)` at `x ≈ 2-4` and `DM Mathematics` at `x ≈ 10`.
- `GitHub` shows sparse load (`x ≈ 0-2`).
---
## **Legend and Color Mapping**
- **Color Scale**:
- `0` (light yellow) to `10` (dark red).
- Intermediate values (e.g., `2`, `4`, `6`, `8`) correspond to progressively darker shades of red.
- **Spatial Grounding**: The legend is positioned at the **bottom** of the image, spanning the full width of the heatmaps.
---
## **Component Isolation**
1. **Header**: Layer titles (e.g., "Aux-Loss-Based Layer 1").
2. **Main Chart**: Heatmaps for each layer, with datasets on the y-axis and relative expert load on the x-axis.
3. **Footer**: Legend with color scale.
---
## **Cross-Reference Verification**
- **Legend Colors**: All dark red cells in the heatmaps correspond to values near `10`, while light yellow cells align with `0`.
- **Data Consistency**: No discrepancies observed between legend colors and heatmap intensities.
---
## **Summary**
The heatmaps illustrate the distribution of **relative expert load** across three datasets (`Wikipedia (en)`, `GitHub`, `DM Mathematics`) for six layers of two types: **Aux-Loss-Based** and **Aux-Loss-Free**. Dark red regions indicate higher expert load, while light yellow regions indicate lower load. The patterns suggest that `Wikipedia (en)` and `DM Mathematics` exhibit more pronounced load variations compared to `GitHub`, which generally shows lower or more uniform load across layers.