## Diagram: CLD Intuition and Qualitative Comparison
### Overview
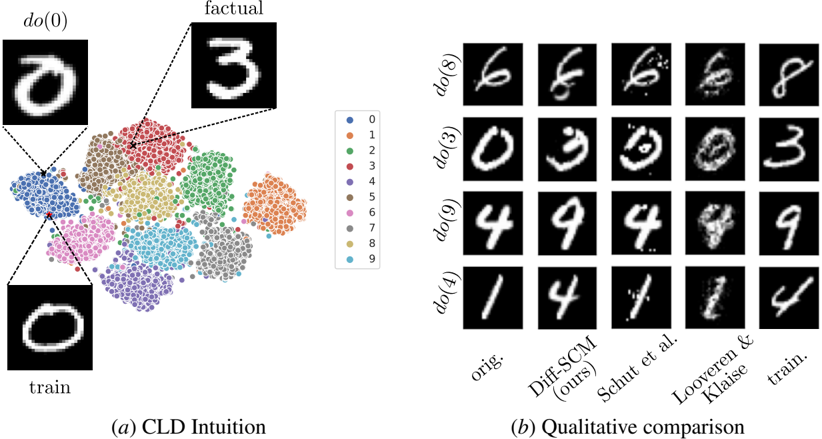
The image presents two diagrams. The left diagram, labeled "(a) CLD Intuition," shows a scatter plot where data points are colored according to digit labels (0-9). Example images of digits are placed near clusters in the scatter plot. The right diagram, labeled "(b) Qualitative comparison," displays a grid of images comparing different methods for generating or manipulating handwritten digits.
### Components/Axes
#### (a) CLD Intuition
* **Scatter Plot:** A 2D scatter plot where each point represents a data sample.
* **Color-Coded Labels:** The points are colored according to the digit they represent, as indicated by the legend:
* Blue: 0
* Orange: 1
* Green: 2
* Red: 3
* Purple: 4
* Brown: 5
* Pink: 6
* Gray: 7
* Yellow-Green: 8
* Teal: 9
* **Example Images:** Three example images of handwritten digits are shown:
* Top-left: Labeled "do(0)" and shows a handwritten "0".
* Top-right: Labeled "factual" and shows a handwritten "3".
* Bottom-left: Labeled "train" and shows a handwritten "0".
#### (b) Qualitative comparison
* **Grid of Images:** A 4x5 grid of images, each displaying a handwritten digit.
* **Rows:** Each row is labeled with a "do(x)" value, indicating a specific digit:
* Row 1: do(8)
* Row 2: do(3)
* Row 3: do(9)
* Row 4: do(4)
* **Columns:** Each column represents a different method or source:
* Column 1: "orig." (original)
* Column 2: "Diff-SCM (ours)"
* Column 3: "Schut et al."
* Column 4: "Looveren & Klaise"
* Column 5: "train."
### Detailed Analysis
#### (a) CLD Intuition
* The scatter plot shows clusters of points, with each cluster primarily composed of points with the same color (digit label).
* The "0" cluster (blue) is located in the bottom-left.
* The "3" cluster (red) is located in the top-right.
* The "train" image of "0" is connected to the "0" cluster.
* The "factual" image of "3" is connected to the "3" cluster.
* The "do(0)" image of "0" is connected to the "0" cluster.
#### (b) Qualitative comparison
* The "orig." column shows the original handwritten digits.
* The "Diff-SCM (ours)" column shows the digits generated or manipulated by the Diff-SCM method.
* The "Schut et al." column shows the digits generated or manipulated by the Schut et al. method.
* The "Looveren & Klaise" column shows the digits generated or manipulated by the Looveren & Klaise method.
* The "train." column shows the digits from the training set.
* The images in the "Diff-SCM (ours)" column appear to be more similar to the original digits compared to the "Schut et al." and "Looveren & Klaise" columns.
### Key Observations
* The CLD Intuition diagram shows that the data samples are clustered according to their digit labels.
* The Qualitative comparison diagram shows that the Diff-SCM method generates digits that are more similar to the original digits compared to the other methods.
### Interpretation
The CLD Intuition diagram visualizes how data points representing handwritten digits are grouped based on their labels. This suggests that the feature space used to represent these digits allows for effective clustering. The Qualitative comparison diagram demonstrates the performance of different methods for generating or manipulating handwritten digits. The Diff-SCM method appears to produce results that are visually closer to the original digits, indicating a potentially better performance in preserving the original characteristics of the digits. The image suggests that Diff-SCM is a more effective method for generating or manipulating handwritten digits compared to Schut et al. and Looveren & Klaise.