## Line Graph: D12 (92.8M) α Profile (Inverted-U)
### Overview
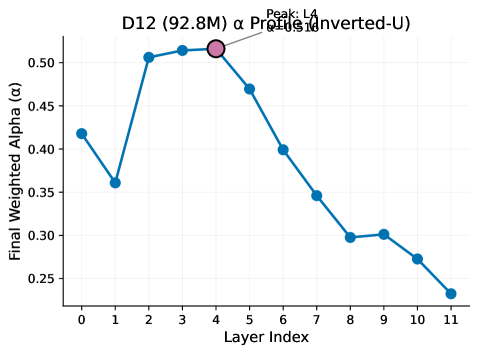
The image depicts a line graph illustrating the "Final Weighted Alpha (α)" values across 12 layers (Layer Index 0–11) for a model labeled "D12 (92.8M)". The graph shows a clear inverted-U trend, with a peak at Layer 4 (α = 0.516). The y-axis ranges from 0.25 to 0.50, while the peak value slightly exceeds this range. The line is blue, and the peak is marked with a pink circle and annotated text.
---
### Components/Axes
- **X-Axis (Layer Index)**: Labeled "Layer Index" with integer values from 0 to 11.
- **Y-Axis (Final Weighted Alpha)**: Labeled "Final Weighted Alpha (α)" with values from 0.25 to 0.50 in increments of 0.05.
- **Legend**: Located at the top-left, labeled "D12 (92.8M)" with a blue line.
- **Annotations**:
- Peak at Layer 4 marked with a pink circle.
- Text annotation: "Peak: L4 α = 0.516".
---
### Detailed Analysis
- **Line Data**:
- Layer 0: α ≈ 0.41
- Layer 1: α ≈ 0.36
- Layer 2: α ≈ 0.50
- Layer 3: α ≈ 0.51
- Layer 4: α ≈ 0.516 (peak)
- Layer 5: α ≈ 0.47
- Layer 6: α ≈ 0.40
- Layer 7: α ≈ 0.35
- Layer 8: α ≈ 0.30
- Layer 9: α ≈ 0.30
- Layer 10: α ≈ 0.27
- Layer 11: α ≈ 0.23
- **Trend Verification**:
- The line starts at 0.41 (Layer 0), drops to 0.36 (Layer 1), then rises sharply to 0.516 (Layer 4), followed by a gradual decline to 0.23 (Layer 11). The inverted-U shape is consistent with the annotation.
- **Spatial Grounding**:
- Legend: Top-left corner, blue line.
- Peak annotation: Centered above Layer 4, pink circle with black text.
---
### Key Observations
1. **Peak at Layer 4**: The highest α value (0.516) occurs at Layer 4, slightly exceeding the y-axis maximum (0.50).
2. **Inverted-U Shape**: Values increase from Layer 0 to 4, then decrease monotonically.
3. **Initial Drop**: A sharp decline from Layer 0 (0.41) to Layer 1 (0.36) suggests Layer 1 contributes less than Layer 0.
4. **Post-Peak Decline**: After Layer 4, α decreases by ~0.28 over 7 layers, indicating diminishing returns or negative contributions from deeper layers.
---
### Interpretation
The inverted-U profile suggests that Layer 4 is the optimal layer for the model's performance, as measured by α. This could imply:
- **Layer 4 Specialization**: Layer 4 may encode critical features for the task (e.g., in a neural network).
- **Diminishing Returns**: Deeper layers (5–11) contribute less effectively, possibly due to overfitting, redundancy, or noise.
- **Layer 1 Anomaly**: The drop from Layer 0 to 1 might indicate architectural inefficiencies or suboptimal initialization in early layers.
The data highlights the importance of Layer 4 in the D12 model, warranting further investigation into its role in the model's architecture or training process.