## Algorithm Performance Comparison
### Overview
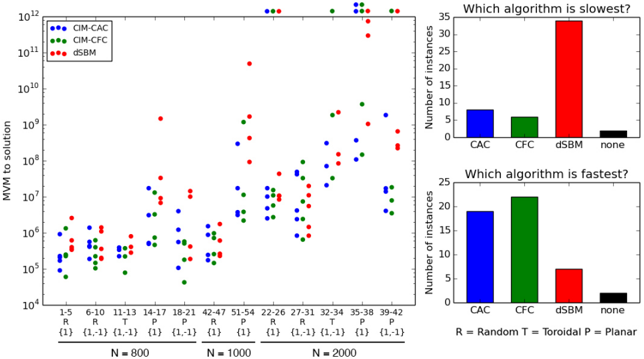
The image presents a comparison of three algorithms (CIM-CAC, CIM-CFC, and dSBM) based on their performance in solving instances of varying sizes (N = 800, N = 1000, N = 2000) and types (Random, Toroidal, Planar). The performance is measured by "MVM to solution" on a logarithmic scale. Additionally, the image includes bar charts indicating which algorithm is the "slowest" and "fastest" based on the number of instances.
### Components/Axes
**Main Scatter Plot:**
* **Y-axis:** "MVM to solution" (Matrix-Vector Multiplication to solution), logarithmic scale from 10^4 to 10^12.
* **X-axis:** Categorical axis representing different instance groups, divided by N values (800, 1000, 2000) and instance types (R, T, P) with corresponding values {1} or {1,-1}.
* N = 800:
* 1-5: R {1}
* 6-10: R {1,-1}
* 11-13: T {1,-1}
* 14-17: P {1}
* 18-21: P {1,-1}
* N = 1000:
* 42-47: R {1}
* 51-54: P {1}
* N = 2000:
* 22-26: R {1}
* 27-31: R {1,-1}
* 32-34: T {1,-1}
* 35-38: P {1}
* 39-42: P {1,-1}
* **Legend (top-left):**
* Blue: CIM-CAC
* Green: CIM-CFC
* Red: dSBM
**Bar Charts (top-right and bottom-right):**
* **Y-axis:** "Number of instances" (linear scale).
* **X-axis:** Algorithm names (CAC, CFC, dSBM, none).
* **Top Bar Chart:** "Which algorithm is slowest?"
* **Bottom Bar Chart:** "Which algorithm is fastest?"
**Legend (bottom):**
* R = Random
* T = Toroidal
* P = Planar
### Detailed Analysis
**Main Scatter Plot:**
* **CIM-CAC (Blue):** Generally shows lower MVM values compared to dSBM, especially for N=800 and N=1000. The values increase as N increases to 2000.
* **CIM-CFC (Green):** Similar to CIM-CAC, with relatively lower MVM values, but with some instances showing higher values. The values increase as N increases to 2000.
* **dSBM (Red):** Shows a wider range of MVM values, with many instances having significantly higher values than CIM-CAC and CIM-CFC, especially for N=2000.
**Specific Data Points (Approximate):**
* For N=800, R {1}, MVM values range approximately from 10^5 to 10^7 for all algorithms.
* For N=2000, P {1,-1}, dSBM reaches values close to 10^12, while CIM-CAC and CIM-CFC are around 10^7 to 10^9.
**Bar Charts:**
* **Slowest Algorithm:**
* CAC: ~7 instances
* CFC: ~6 instances
* dSBM: ~33 instances
* None: ~1 instance
* **Fastest Algorithm:**
* CAC: ~19 instances
* CFC: ~22 instances
* dSBM: ~7 instances
* None: ~2 instances
### Key Observations
* dSBM tends to require a higher number of MVM operations to reach a solution compared to CIM-CAC and CIM-CFC, especially for larger problem sizes (N=2000).
* CIM-CAC and CIM-CFC show more consistent and lower MVM values across different instance types and sizes.
* According to the bar charts, dSBM is most frequently the slowest algorithm, while CIM-CFC is most frequently the fastest.
### Interpretation
The data suggests that CIM-CAC and CIM-CFC are generally more efficient algorithms for solving these types of instances, as they require fewer matrix-vector multiplications to reach a solution. dSBM, while sometimes faster, is more often the slowest and exhibits a wider range of performance, indicating it may be more sensitive to the specific characteristics of the problem instance. The bar charts reinforce this conclusion, showing that dSBM is most often the slowest, while CIM-CFC is most often the fastest. The "none" category in both bar charts suggests that in some instances, none of the tested algorithms were particularly fast or slow compared to some baseline or expectation. The increase in MVM values as N increases to 2000 is expected, as larger problem sizes generally require more computational effort.