\n
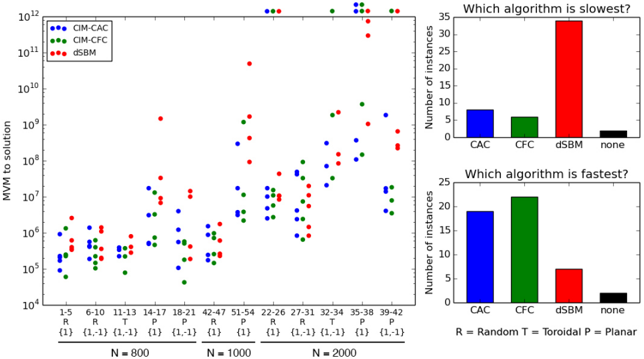
## Scatter Plot and Bar Charts: Algorithm Performance Comparison
### Overview
The image is a composite figure containing three plots that compare the performance of three algorithms—CIM-CAC (blue), CIM-CFC (green), and dSBM (red)—on a problem likely related to Maximum Weight Independent Set (MWIS). The left panel is a scatter plot showing solution times across different problem instances. The right panel contains two bar charts summarizing which algorithm was slowest and fastest across all instances.
### Components/Axes
**Left Panel: Scatter Plot**
- **Y-axis**: "MWIS to solution" (logarithmic scale, base 10). Values range from 10⁴ to 10¹².
- **X-axis**: Problem instances grouped by three parameters:
- **N** (problem size): 800, 1000, 2000.
- **Graph Type** (within each N): R (Random), T (Toroidal), P (Planar).
- **Instance ID**: Numerical ranges (e.g., 1-5, 6-10, etc.) under each graph type.
- **Legend**: Top-left corner.
- Blue square: CIM-CAC
- Green square: CIM-CFC
- Red square: dSBM
- **Bottom Annotation**: "R = Random T = Toroidal P = Planar"
**Right Panel: Bar Charts**
- **Top Chart**: "Which algorithm is slowest?"
- **Y-axis**: "Number of instances" (linear scale, 0 to 35).
- **X-axis**: Algorithm categories: CAC (blue), CFC (green), dSBM (red), none (black).
- **Bottom Chart**: "Which algorithm is fastest?"
- **Y-axis**: "Number of instances" (linear scale, 0 to 25).
- **X-axis**: Same categories as above.
### Detailed Analysis
**Scatter Plot Data Trends & Approximate Values:**
* **General Trend**: For all algorithms, the solution time (MWIS to solution) generally increases as the problem size N increases (from left to right across the N=800, N=1000, and N=2000 groups).
* **CIM-CAC (Blue)**:
- **Trend**: Shows a moderate upward trend with increasing N. Points are widely scattered, indicating high variance in performance across instances.
- **Approximate Range**: From ~10⁵ (for small N, Random graphs) to ~10⁹ (for large N, some Planar graphs).
* **CIM-CFC (Green)**:
- **Trend**: Also trends upward with N, but its points are consistently positioned lower than the blue (CIM-CAC) points for corresponding instances, suggesting it is generally faster.
- **Approximate Range**: From ~10⁴.5 to ~10⁸.5.
* **dSBM (Red)**:
- **Trend**: Shows the steepest increase with N. For N=2000, many red points are at the very top of the chart (10¹²), indicating very long solution times or timeouts.
- **Approximate Range**: From ~10⁵ to 10¹² (the maximum on the chart).
**Bar Chart Data (Approximate Counts):**
* **"Slowest" Chart**:
- CAC (Blue): ~8 instances
- CFC (Green): ~5 instances
- dSBM (Red): ~33 instances
- none (Black): ~2 instances
* **"Fastest" Chart**:
- CAC (Blue): ~19 instances
- CFC (Green): ~22 instances
- dSBM (Red): ~7 instances
- none (Black): ~2 instances
### Key Observations
1. **Performance Hierarchy**: CIM-CFC (green) is most frequently the fastest algorithm and rarely the slowest. dSBM (red) is most frequently the slowest and rarely the fastest. CIM-CAC (blue) occupies a middle ground.
2. **Impact of Problem Size (N)**: The performance gap between algorithms widens significantly as N increases. At N=2000, dSBM points are often orders of magnitude slower than CIM-CFC points.
3. **Impact of Graph Type**: Within each N group, performance varies by graph type (R, T, P). The scatter is substantial, indicating instance-specific difficulty beyond just size and type.
4. **"None" Category**: The small "none" bars in the charts likely represent instances where algorithms tied or where no clear fastest/slowest could be determined.
### Interpretation
This data demonstrates a clear performance advantage for the CIM-CFC algorithm on the tested MWIS problem instances, particularly as problem scale (N) grows. The logarithmic scale on the scatter plot emphasizes that the differences are not minor but often span multiple orders of magnitude. The steep climb of the red (dSBM) points suggests its computational complexity scales poorly with problem size compared to the CIM-based methods. The bar charts provide a summary that reinforces the scatter plot's story: CIM-CFC is the most robust choice for speed, while dSBM is the most likely to be prohibitively slow. The variability within groups (e.g., the wide vertical spread of points for a single "R" category at N=2000) indicates that factors not captured by the N and graph type labels (like specific graph topology or weight distribution) also play a critical role in determining solution time.