## Scatter Plot with Bar Charts: Algorithm Performance Analysis
### Overview
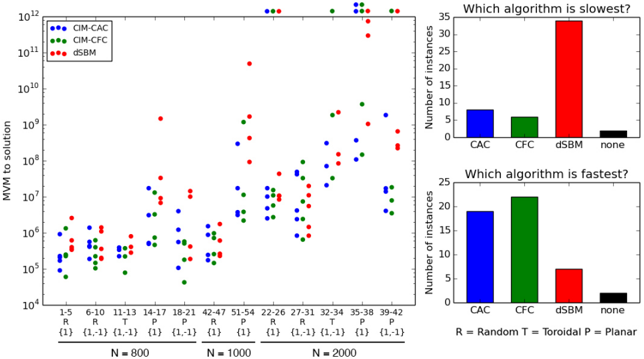
The image presents a scatter plot comparing the Mean Maximum Value (MMV) to solution across different problem instances and algorithms, alongside two bar charts analyzing algorithm speed. The scatter plot uses three data series (CIM-CAC, CIM-CFC, dSBM) with varying problem sizes (N=800, 1000, 2000) and parameters (R=Random, T=Torroidal, P=Planar). The bar charts quantify algorithm performance extremes.
### Components/Axes
**Main Scatter Plot**:
- **X-axis**: Problem size (N=800, 1000, 2000) and parameter combinations (R, T, P). Labels include:
- N=800: R, R, T, P, P
- N=1000: R, T, P, P
- N=2000: R, R, T, P, P
- **Y-axis**: MMV to solution (log scale, 10⁴ to 10¹²).
- **Legend**: Top-right, with:
- Blue: CIM-CAC
- Green: CIM-CFC
- Red: dSBM
**Bar Charts**:
- **Top Chart**: "Which algorithm is slowest?" (Y-axis: Number of instances, 0–30).
- **Bottom Chart**: "Which algorithm is fastest?" (Y-axis: Number of instances, 0–25).
### Detailed Analysis
**Scatter Plot Trends**:
- **CIM-CAC (Blue)**: Points cluster at lower MMV values (10⁵–10⁸) across all N and parameters. Notable outliers at N=2000 (R, T) with MMV ~10¹¹.
- **CIM-CFC (Green)**: Distributed across mid-range MMV (10⁶–10⁹), with higher density at N=1000 (T, P).
- **dSBM (Red)**: Scattered widely, with extreme values (e.g., N=2000, R: MMV ~10¹²; N=800, P: MMV ~10⁷).
**Bar Chart Data**:
- **Slowest Algorithm**:
- dSBM: 30 instances (tallest red bar).
- CAC: 8 instances (blue bar).
- CFC: 5 instances (green bar).
- "None": 1 instance (black bar).
- **Fastest Algorithm**:
- CAC: 18 instances (tallest blue bar).
- CFC: 22 instances (green bar).
- dSBM: 6 instances (red bar).
- "None": 1 instance (black bar).
### Key Observations
1. **MMV Variability**: dSBM exhibits the highest MMV values (up to 10¹²), suggesting slower convergence or larger solution spaces.
2. **Algorithm Speed**: dSBM is the slowest (30 instances), while CAC is the fastest (18 instances).
3. **Parameter Impact**: Torroidal (T) and Planar (P) parameters correlate with higher MMV for dSBM, while Random (R) shows mixed results.
4. **Outliers**: CIM-CAC at N=2000 (R, T) has anomalously high MMV (~10¹¹), deviating from its typical range.
### Interpretation
The data highlights significant differences in algorithm performance:
- **dSBM** struggles with scalability, as evidenced by its dominance in the "slowest" category and extreme MMV values. This may stem from computational complexity or suboptimal parameter handling.
- **CIM-CAC** demonstrates efficiency, achieving the lowest MMV and fastest execution. Its performance remains stable across problem sizes and parameters.
- **CIM-CFC** offers moderate performance, with MMV values intermediate between CIM-CAC and dSBM. Its speed is second only to CAC.
- The "None" category (1 instance each) suggests rare cases where no algorithm was applied or performed exceptionally.
The scatter plot’s log scale emphasizes exponential differences in MMV, while the bar charts quantify algorithmic trade-offs. These results imply that algorithm selection should prioritize problem size, parameter structure, and computational constraints.