## Data Table: Step-by-Step Optimization
### Overview
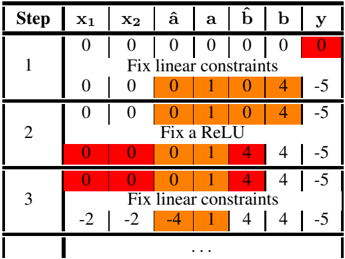
The image presents a data table illustrating a step-by-step optimization process. The table tracks the values of variables x1, x2, â, a, b̂, b, and y across multiple steps. The steps involve fixing linear constraints and a ReLU function. The table uses color-coding to highlight changes in variable values during each step.
### Components/Axes
The table has the following columns:
- **Step**: Indicates the iteration number of the optimization process.
- **x1**: Value of variable x1.
- **x2**: Value of variable x2.
- **â**: Value of variable â.
- **a**: Value of variable a.
- **b̂**: Value of variable b̂.
- **b**: Value of variable b.
- **y**: Value of variable y.
### Detailed Analysis or ### Content Details
**Step 1:**
- x1 = 0, x2 = 0, â = 0, a = 0, b̂ = 0, b = 0, y = 0 (initial values, highlighted in red)
- Action: "Fix linear constraints"
- x1 = 0, x2 = 0, â = 0, a = 1, b̂ = 0, b = 4, y = -5 (values after fixing linear constraints, highlighted in orange)
**Step 2:**
- x1 = 0, x2 = 0, â = 0, a = 1, b̂ = 0, b = 4, y = -5 (values carried over from the previous step)
- Action: "Fix a ReLU"
- x1 = 0, x2 = 0, â = 0, a = 1, b̂ = 4, b = 4, y = -5 (b̂ changes to 4, highlighted in red)
**Step 3:**
- x1 = 0, x2 = 0, â = 0, a = 1, b̂ = 4, b = 4, y = -5 (values carried over from the previous step)
- Action: "Fix linear constraints"
- x1 = -2, x2 = -2, â = -4, a = 1, b̂ = 4, b = 4, y = -5 (x1, x2, and â change, highlighted in orange)
The table continues with further steps, indicated by "...".
### Key Observations
- The optimization process involves alternating between fixing linear constraints and a ReLU function.
- The values of the variables change during each step, indicating the progress of the optimization.
- The color-coding highlights the variables that are being updated in each step.
### Interpretation
The data table illustrates an iterative optimization process, likely related to machine learning or neural networks. The process aims to find optimal values for the variables by repeatedly fixing linear constraints and applying a ReLU function. The changes in variable values at each step reflect the algorithm's attempt to minimize or maximize a certain objective function. The table provides a detailed view of how the variables evolve during the optimization process. The "..." suggests that the process continues until a convergence criterion is met.