## Box Plot: Metrics Comparison for Different Algorithms
### Overview
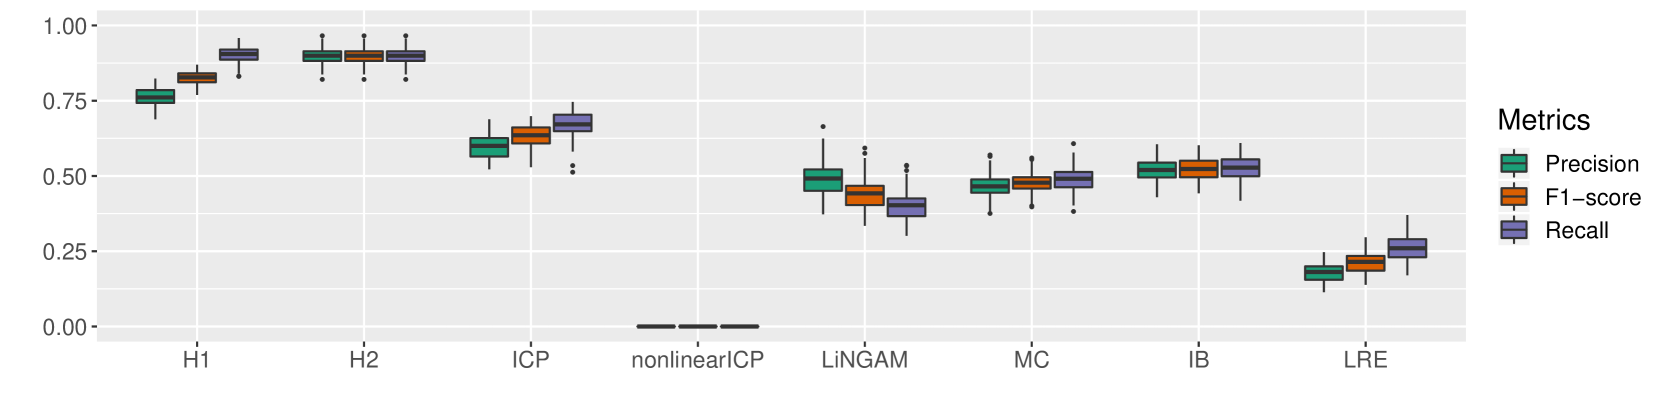
The image is a box plot comparing the performance of different algorithms based on three metrics: Precision, F1-score, and Recall. The algorithms are labeled on the x-axis, and the metric values are on the y-axis, ranging from 0.00 to 1.00. The legend on the right side of the plot indicates the color-coding for each metric: green for Precision, orange for F1-score, and purple for Recall.
### Components/Axes
* **X-axis:** Algorithms - H1, H2, ICP, nonlinearICP, LINGAM, MC, IB, LRE
* **Y-axis:** Metric values ranging from 0.00 to 1.00, with increments of 0.25.
* **Legend (Top-Right):**
* Green: Precision
* Orange: F1-score
* Purple: Recall
### Detailed Analysis
The box plots show the distribution of each metric for each algorithm.
* **H1:** Precision, F1-score, and Recall are relatively high, with median values around 0.75, 0.80, and 0.85 respectively.
* **H2:** All three metrics are very high, with median values close to 0.90 or above.
* **ICP:** Precision and F1-score are around 0.60-0.70, while Recall is slightly higher, around 0.70-0.75.
* **nonlinearICP:** All three metrics are very low, close to 0.00.
* **LINGAM:** Precision and F1-score are around 0.40-0.50, while Recall is slightly lower, around 0.35-0.45.
* **MC:** Precision, F1-score, and Recall are relatively similar, with median values around 0.50.
* **IB:** Precision, F1-score, and Recall are relatively similar, with median values around 0.50-0.55.
* **LRE:** Precision, F1-score, and Recall are the lowest among all algorithms, with median values around 0.20-0.30.
### Key Observations
* Algorithms H1 and H2 perform significantly better than the others, with high Precision, F1-score, and Recall.
* nonlinearICP performs the worst, with all metrics close to zero.
* LRE also performs poorly compared to other algorithms.
* The other algorithms (ICP, LINGAM, MC, IB) have moderate performance, with metric values ranging from 0.40 to 0.75.
### Interpretation
The box plot provides a visual comparison of the performance of different algorithms based on Precision, F1-score, and Recall. The results suggest that H1 and H2 are the most effective algorithms, while nonlinearICP is the least effective. The other algorithms have moderate performance, with varying degrees of Precision, F1-score, and Recall. The plot highlights the importance of selecting the appropriate algorithm for a given task, as the choice of algorithm can significantly impact performance. The near-zero performance of "nonlinearICP" is a notable outlier, suggesting a potential issue with its implementation or suitability for the task. The consistently low performance of "LRE" indicates it may not be a good choice for scenarios where high precision, recall, and F1-score are desired.