## Box Plot: Performance Metrics by Method
### Overview
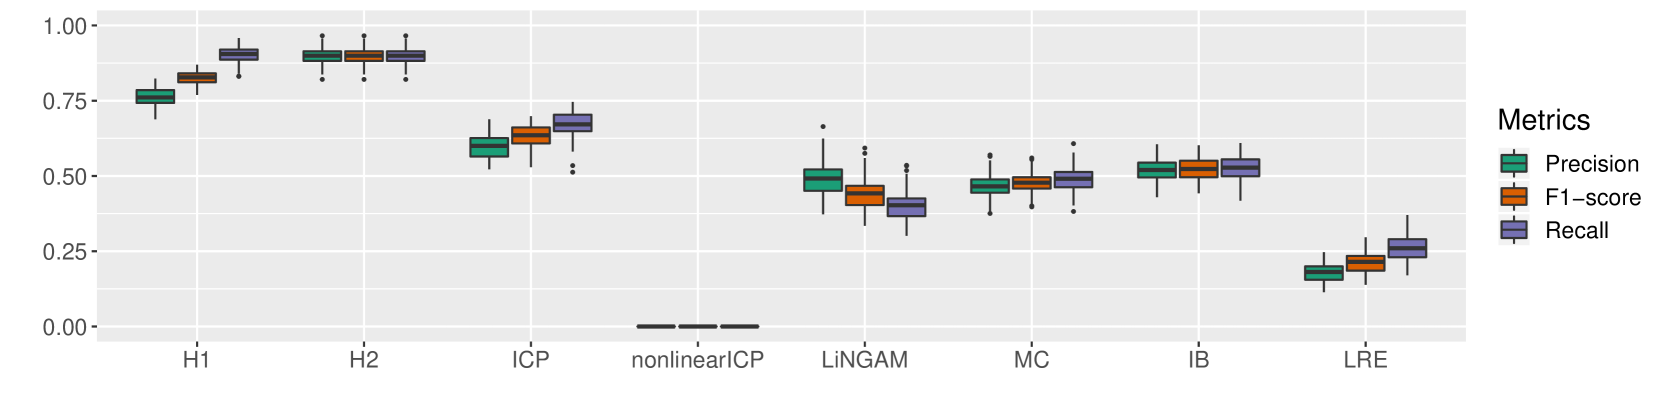
This image displays a grouped box plot comparing the performance of eight distinct methods (H1, H2, ICP, nonlinearICP, LiNGAM, MC, IB, LRE) across three performance metrics: Precision, F1-score, and Recall. The Y-axis represents a normalized performance score ranging from 0.00 to 1.00.
### Components/Axes
* **Y-Axis:** Numerical scale from 0.00 to 1.00, with major grid lines at 0.25 intervals.
* **X-Axis:** Categorical labels for the methods: H1, H2, ICP, nonlinearICP, LiNGAM, MC, IB, LRE.
* **Legend (Right side):**
* **Green box:** Precision
* **Orange box:** F1-score
* **Purple box:** Recall
### Detailed Analysis
The following values are approximate based on the visual representation of the box plot medians:
| Method | Precision (Green) | F1-score (Orange) | Recall (Purple) | Trend |
| :--- | :--- | :--- | :--- | :--- |
| **H1** | ~0.76 | ~0.83 | ~0.91 | Increasing |
| **H2** | ~0.90 | ~0.90 | ~0.90 | Flat/Consistent |
| **ICP** | ~0.60 | ~0.63 | ~0.67 | Increasing |
| **nonlinearICP** | 0.00 | 0.00 | 0.00 | Flat (Zero) |
| **LiNGAM** | ~0.49 | ~0.45 | ~0.40 | Decreasing |
| **MC** | ~0.47 | ~0.48 | ~0.49 | Slightly Increasing |
| **IB** | ~0.52 | ~0.52 | ~0.53 | Slightly Increasing |
| **LRE** | ~0.18 | ~0.21 | ~0.26 | Increasing |
* **Spatial Grounding:** The legend is positioned on the far right, vertically centered. The X-axis labels are centered beneath their respective clusters.
### Key Observations
* **Top Performer:** H2 demonstrates the highest and most consistent performance across all three metrics, with medians clustered tightly around 0.90.
* **The "nonlinearICP" Anomaly:** This method shows zero performance across all metrics, appearing as a flat line at the bottom of the chart. This suggests a total failure of the method on the dataset, or that the method is fundamentally incompatible with the test parameters.
* **Metric Relationships:**
* **Increasing Trend (Recall > Precision):** H1, ICP, and LRE show a pattern where Recall is higher than Precision.
* **Decreasing Trend (Precision > Recall):** LiNGAM is the only method where Precision is notably higher than Recall.
* **Balanced:** H2, MC, and IB show relatively balanced performance across all three metrics.
* **Variance:** Most methods show relatively tight interquartile ranges (the boxes), indicating consistent performance. Outliers (represented by individual dots) are visible in H1, ICP, LiNGAM, and MC, suggesting occasional instability in those methods.
### Interpretation
This chart appears to be a benchmark comparison of causal discovery or feature selection algorithms.
* **Performance Hierarchy:** H2 is clearly the most robust method for this specific task. H1 and ICP are secondary, providing respectable performance.
* **Methodological Failure:** The "nonlinearICP" result is a significant outlier. In a technical context, this usually indicates that the algorithm failed to converge, produced null results, or the data structure violated the assumptions required by the nonlinearICP algorithm.
* **Trade-offs:** The variation in the "Metric Relationships" (e.g., H1 favoring Recall vs. LiNGAM favoring Precision) suggests that the choice of method should be dictated by the specific requirements of the user—whether they prioritize minimizing false positives (Precision) or minimizing false negatives (Recall).