TECHNICAL ASSET FINGERPRINT
72a78ac4a661997eed1a820d
Click to view fullscreen
Press ESC or click to close
FOUND IN PAPERS
EXPERT: healer-alpha-free VERSION 1
RUNTIME: free/openrouter/healer-alpha
INTEL_VERIFIED
## Box Plot Chart: Performance Metrics of Various Methods
### Overview
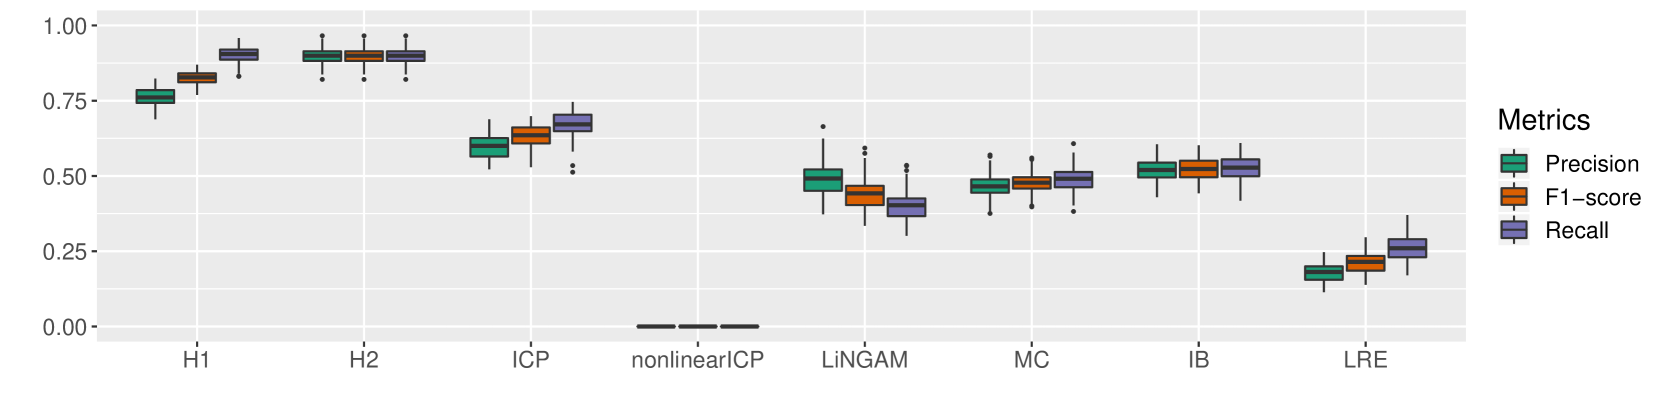
The image displays a box plot chart comparing the performance of eight different methods (H1, H2, ICP, nonlinearICP, LiNGAM, MC, IB, LRE) across three evaluation metrics: Precision, F1-score, and Recall. The chart uses a light gray background with white grid lines. The y-axis represents a score ranging from 0.00 to 1.00. The legend is positioned on the right side of the chart.
### Components/Axes
* **Chart Type:** Grouped Box Plot.
* **X-axis (Categorical):** Lists eight methods. From left to right: `H1`, `H2`, `ICP`, `nonlinearICP`, `LiNGAM`, `MC`, `IB`, `LRE`.
* **Y-axis (Numerical):** Labeled from `0.00` to `1.00` in increments of 0.25. The axis title is not explicitly shown, but the scale represents a performance score (likely proportion or probability).
* **Legend:** Located on the right side, titled "Metrics". It defines the color coding for the three box plots per method:
* **Teal/Green:** `Precision`
* **Orange:** `F1-score`
* **Purple:** `Recall`
* **Data Representation:** For each method, three adjacent box plots show the distribution of results for each metric. Each box plot displays the median (center line), interquartile range (IQR, the box), whiskers (extending to 1.5x IQR), and individual points for outliers beyond the whiskers.
### Detailed Analysis
**Method-by-Method Breakdown (Approximate Values):**
1. **H1:**
* **Precision (Teal):** Median ~0.75, tight IQR (approx. 0.73-0.77), whiskers from ~0.68 to ~0.80. No visible outliers.
* **F1-score (Orange):** Median ~0.80, IQR ~0.78-0.83, whiskers ~0.75 to ~0.85. No visible outliers.
* **Recall (Purple):** Median ~0.90, IQR ~0.88-0.92, whiskers ~0.85 to ~0.95. No visible outliers.
* *Trend:* All metrics are high, with Recall > F1-score > Precision. Distributions are compact.
2. **H2:**
* **Precision (Teal):** Median ~0.90, IQR ~0.88-0.92, whiskers ~0.85 to ~0.95. One outlier below ~0.82.
* **F1-score (Orange):** Median ~0.90, IQR ~0.88-0.92, whiskers ~0.85 to ~0.95. One outlier below ~0.82.
* **Recall (Purple):** Median ~0.90, IQR ~0.88-0.92, whiskers ~0.85 to ~0.95. One outlier below ~0.82.
* *Trend:* All three metrics are very high and nearly identical in distribution, clustering around 0.90.
3. **ICP:**
* **Precision (Teal):** Median ~0.60, IQR ~0.55-0.65, whiskers ~0.50 to ~0.70. No visible outliers.
* **F1-score (Orange):** Median ~0.65, IQR ~0.60-0.70, whiskers ~0.55 to ~0.75. No visible outliers.
* **Recall (Purple):** Median ~0.70, IQR ~0.65-0.75, whiskers ~0.60 to ~0.80. Several outliers below ~0.55.
* *Trend:* Moderate performance. Recall > F1-score > Precision. Recall shows more variability with low outliers.
4. **nonlinearICP:**
* **Precision (Teal), F1-score (Orange), Recall (Purple):** All metrics show a flat line at `0.00`. The box plots are collapsed, indicating no variance and a score of zero across all runs.
* *Trend:* Complete failure across all metrics.
5. **LiNGAM:**
* **Precision (Teal):** Median ~0.50, IQR ~0.45-0.55, whiskers ~0.35 to ~0.65. One high outlier near ~0.65.
* **F1-score (Orange):** Median ~0.45, IQR ~0.40-0.50, whiskers ~0.30 to ~0.60. Several outliers above ~0.55.
* **Recall (Purple):** Median ~0.40, IQR ~0.35-0.45, whiskers ~0.25 to ~0.55. Several outliers above ~0.50.
* *Trend:* Moderate to low performance. Precision > F1-score > Recall. Shows significant variability and outliers.
6. **MC:**
* **Precision (Teal):** Median ~0.48, IQR ~0.45-0.52, whiskers ~0.38 to ~0.58. One outlier below ~0.35.
* **F1-score (Orange):** Median ~0.48, IQR ~0.45-0.52, whiskers ~0.40 to ~0.55. One outlier below ~0.38.
* **Recall (Purple):** Median ~0.50, IQR ~0.45-0.55, whiskers ~0.35 to ~0.60. One outlier below ~0.35.
* *Trend:* All metrics are tightly clustered around 0.50 with similar, moderate spreads.
7. **IB:**
* **Precision (Teal):** Median ~0.52, IQR ~0.50-0.55, whiskers ~0.45 to ~0.60. No visible outliers.
* **F1-score (Orange):** Median ~0.52, IQR ~0.50-0.55, whiskers ~0.48 to ~0.58. No visible outliers.
* **Recall (Purple):** Median ~0.53, IQR ~0.50-0.56, whiskers ~0.45 to ~0.60. No visible outliers.
* *Trend:* Very consistent performance across all three metrics, centered just above 0.50 with low variance.
8. **LRE:**
* **Precision (Teal):** Median ~0.18, IQR ~0.15-0.22, whiskers ~0.10 to ~0.25. No visible outliers.
* **F1-score (Orange):** Median ~0.22, IQR ~0.18-0.25, whiskers ~0.15 to ~0.30. No visible outliers.
* **Recall (Purple):** Median ~0.28, IQR ~0.25-0.32, whiskers ~0.20 to ~0.38. No visible outliers.
* *Trend:* Poor performance across all metrics. Recall > F1-score > Precision. All values are below 0.40.
### Key Observations
1. **Performance Tiers:** The methods fall into distinct performance clusters:
* **High Performers:** H1 and H2 (scores > 0.75).
* **Moderate Performers:** ICP, LiNGAM, MC, IB (scores roughly between 0.40 and 0.70).
* **Low Performer:** LRE (scores < 0.40).
* **Complete Failure:** nonlinearICP (score = 0.00).
2. **Metric Consistency:** H2, MC, and IB show remarkable consistency between Precision, F1-score, and Recall, with their box plots nearly overlapping. Other methods (H1, ICP, LiNGAM, LRE) show a consistent ordinal relationship where Recall > F1-score > Precision.
3. **Variability:** LiNGAM exhibits the highest variability and most outliers. H2, MC, and IB show the lowest variability. nonlinearICP shows zero variability.
4. **Critical Outlier:** The `nonlinearICP` method is a significant outlier, scoring exactly 0.00 for all metrics, indicating a fundamental failure in the evaluated context.
### Interpretation
This chart provides a comparative benchmark of causal discovery or statistical inference methods. The data suggests:
* **Method Effectiveness:** H1 and H2 are the most effective and reliable methods under the tested conditions, achieving high scores across all evaluation criteria. H2 shows slightly better consistency and higher median scores than H1.
* **Method Failure:** The catastrophic failure of `nonlinearICP` (0.00 scores) is the most striking finding. This indicates the method either did not run, produced invalid output, or was completely mismatched to the problem setup. This warrants immediate investigation into its implementation or applicability.
* **Trade-offs:** Methods like ICP and LiNGAM show a clear trade-off where they achieve higher Recall at the cost of lower Precision. This is characteristic of methods that are more sensitive (find more true positives) but less precise (generate more false positives).
* **Middle Ground:** MC and IB represent a stable middle ground, offering moderate and balanced performance with low variance, making them potentially reliable if not top-performing choices.
* **Poor Suitability:** LRE demonstrates poor suitability for the task, performing significantly worse than all other methods except the failed nonlinearICP.
In summary, the visualization effectively ranks the methods, highlights the exceptional performance of H1/H2, exposes the critical failure of nonlinearICP, and reveals characteristic performance profiles (e.g., high-Recall/low-Precision for ICP/LiNGAM) that can guide method selection based on specific project priorities (e.g., favoring precision vs. recall).
DECODING INTELLIGENCE...