## Box Plot Chart: Performance Metrics Across Different Models
### Overview
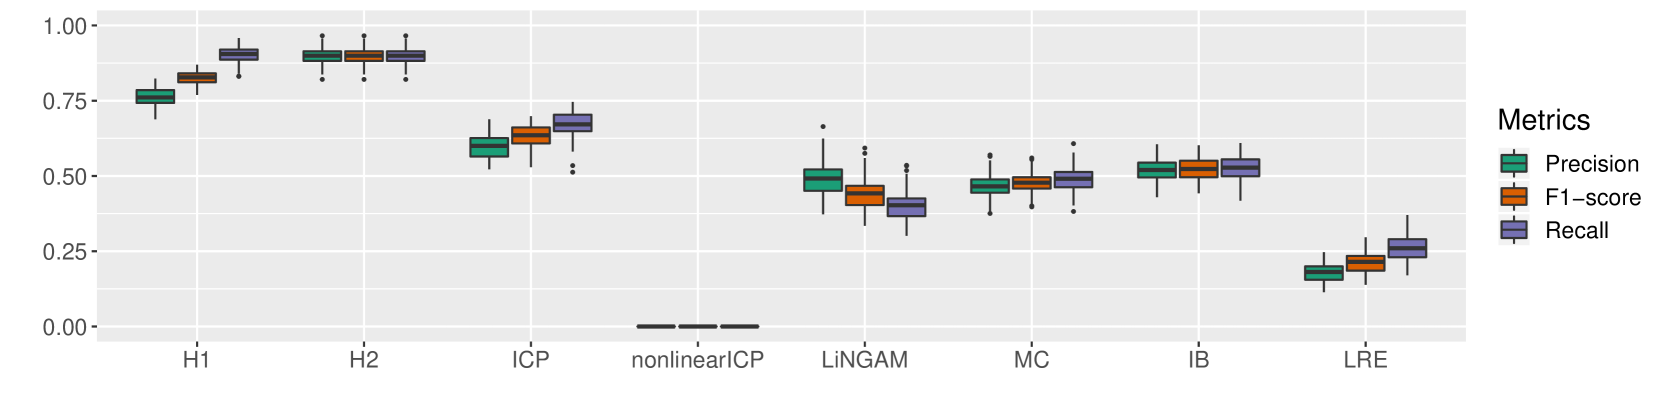
The chart compares performance metrics (Precision, F1-score, Recall) across eight categories (H1, H2, ICP, nonlinearICP, LiNGAM, MC, IB, LRE) using box plots. Each metric is represented by a distinct color: green (Precision), orange (F1-score), and purple (Recall). Outliers are marked as individual dots outside the box plots.
### Components/Axes
- **X-axis**: Categories (H1, H2, ICP, nonlinearICP, LiNGAM, MC, IB, LRE)
- **Y-axis**: Metric values ranging from 0.00 to 1.00
- **Legend**:
- Green: Precision
- Orange: F1-score
- Purple: Recall
- **Legend Position**: Right side of the chart
### Detailed Analysis
1. **H1**:
- Precision: ~0.75 (median), range ~0.70–0.80
- F1-score: ~0.80 (median), range ~0.75–0.85
- Recall: ~0.90 (median), range ~0.85–0.95
- Outliers: None
2. **H2**:
- Precision: ~0.85 (median), range ~0.80–0.90
- F1-score: ~0.88 (median), range ~0.85–0.92
- Recall: ~0.92 (median), range ~0.88–0.95
- Outliers: None
3. **ICP**:
- Precision: ~0.60 (median), range ~0.55–0.65
- F1-score: ~0.62 (median), range ~0.58–0.66
- Recall: ~0.68 (median), range ~0.62–0.72
- Outliers: None
4. **nonlinearICP**:
- All metrics: ~0.00 (flat line at baseline)
- Outliers: None
5. **LiNGAM**:
- Precision: ~0.45 (median), range ~0.40–0.50
- F1-score: ~0.42 (median), range ~0.38–0.46
- Recall: ~0.35 (median), range ~0.30–0.40
- Outliers: One dot at ~0.65 (Precision)
6. **MC**:
- Precision: ~0.48 (median), range ~0.45–0.52
- F1-score: ~0.47 (median), range ~0.44–0.51
- Recall: ~0.49 (median), range ~0.46–0.53
- Outliers: None
7. **IB**:
- Precision: ~0.52 (median), range ~0.48–0.56
- F1-score: ~0.53 (median), range ~0.50–0.57
- Recall: ~0.54 (median), range ~0.51–0.58
- Outliers: None
8. **LRE**:
- Precision: ~0.18 (median), range ~0.15–0.22
- F1-score: ~0.20 (median), range ~0.18–0.24
- Recall: ~0.25 (median), range ~0.22–0.30
- Outliers: None
### Key Observations
- **Highest Performance**: H2 consistently shows the highest median values across all metrics.
- **Lowest Performance**: LRE has the lowest medians, with Recall slightly outperforming other metrics.
- **Outliers**: LiNGAM’s Precision has a single outlier (~0.65), significantly higher than its median.
- **Flat Line**: nonlinearICP shows no variation, with all metrics at ~0.00.
### Interpretation
The chart suggests that **H2** is the most robust model, achieving near-perfect performance (median ~0.85–0.92) across all metrics. **LRE** underperforms significantly, with medians below 0.30 for Recall and F1-score. The **nonlinearICP** category appears to represent a baseline or control group, as all metrics are near zero. The outlier in LiNGAM’s Precision indicates potential variability in specific instances, though its overall performance remains poor. The consistent alignment of medians across metrics (e.g., H1’s Recall ~0.90 vs. F1-score ~0.80) implies a trade-off between precision and recall in some models.