\n
## Grid Diagram: Distribution of Trees and Triangles
### Overview
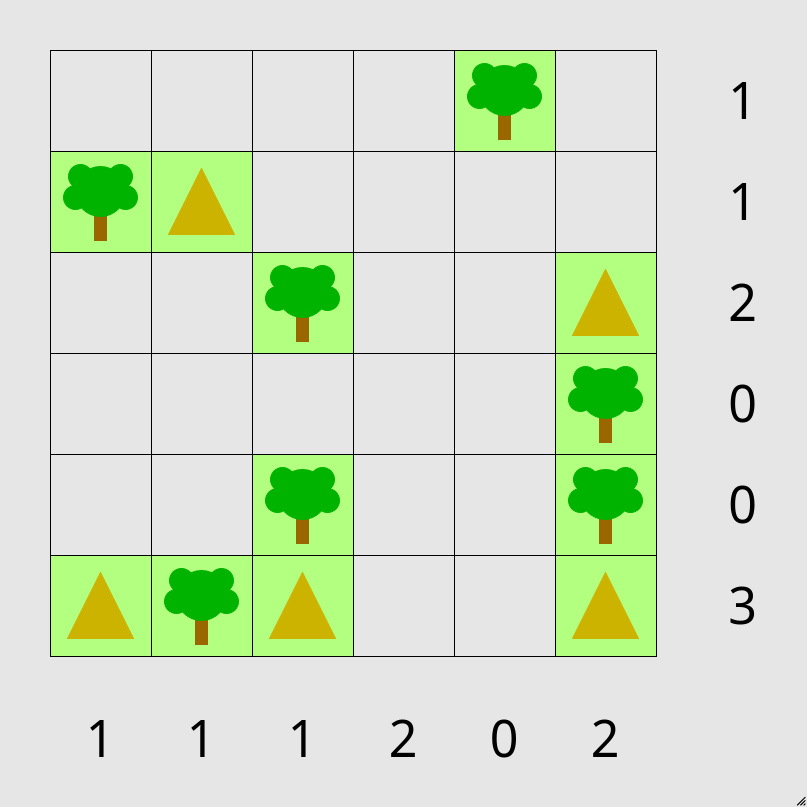
The image presents a 6x6 grid containing two types of symbols: green trees and yellow triangles. The grid is annotated with numerical values along both the horizontal and vertical axes. The arrangement appears to represent a distribution or mapping of these symbols across a two-dimensional space.
### Components/Axes
* **Grid:** A 6x6 square grid.
* **Symbols:** Green tree shapes and yellow triangle shapes.
* **Horizontal Axis:** Labeled with numbers 1, 1, 1, 2, 0, 2.
* **Vertical Axis:** Labeled with numbers 1, 1, 2, 0, 0, 3.
* **Grid Cells:** Each cell contains either a tree, a triangle, or is empty.
### Detailed Analysis
The grid can be described as follows, referencing row and column indices (starting from 1):
* **(1,1):** Tree
* **(1,2):** Triangle
* **(1,6):** Tree
* **(2,1):** Tree
* **(2,4):** Triangle
* **(3,3):** Tree
* **(4,2):** Tree
* **(4,5):** Tree
* **(5,1):** Tree
* **(5,3):** Triangle
* **(5,6):** Tree
* **(6,1):** Triangle
* **(6,3):** Triangle
* **(6,6):** Triangle
The number of trees is 8.
The number of triangles is 5.
The number of empty cells is 29.
### Key Observations
* The distribution of trees and triangles is not uniform across the grid.
* The bottom row (row 6) has a higher concentration of triangles.
* The first column (column 1) has a mix of trees and triangles.
* The values on the horizontal and vertical axes do not appear to directly correlate with the placement of the symbols. They seem to be independent labels.
### Interpretation
The image likely represents a spatial distribution of two categories (trees and triangles) within a defined area. The numerical labels on the axes could represent coordinates, categories, or other relevant variables. The arrangement suggests a non-random pattern, potentially indicating a relationship between the location and the type of symbol. Without further context, it's difficult to determine the specific meaning of this distribution. It could represent anything from a simplified map of vegetation and geological features to a visualization of data points in a statistical analysis. The lack of a clear legend or explanation makes a definitive interpretation challenging. The values on the axes are not directly related to the number of trees or triangles in each row or column. They are simply labels.