## Grid Matrix: Symbol Distribution Pattern
### Overview
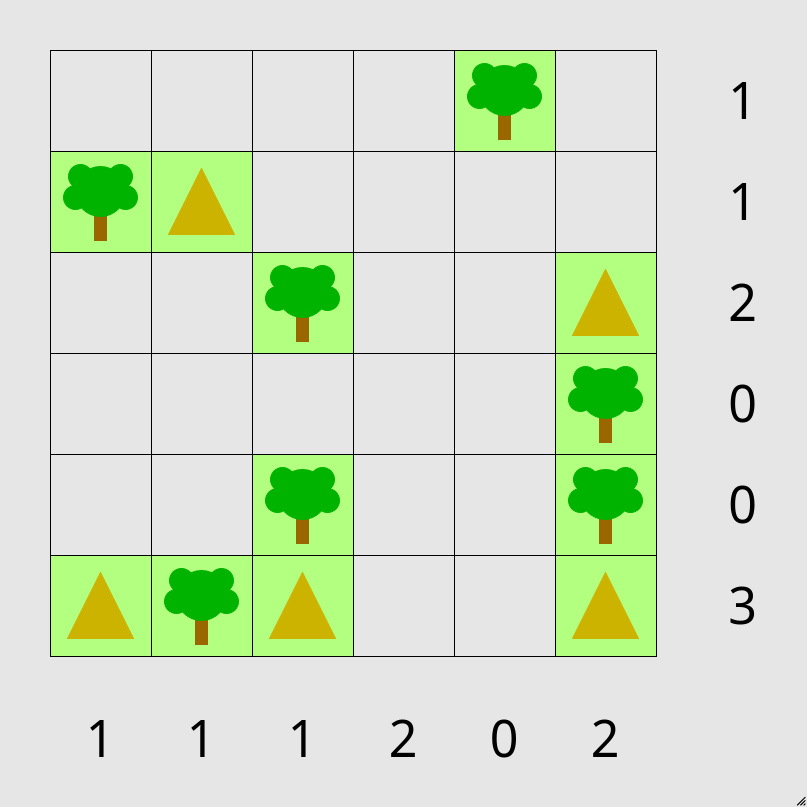
The image displays a 6x6 grid with symbolic elements (green trees and orange triangles) positioned in specific cells. Numerical labels are present on the right vertical axis (rows) and bottom horizontal axis (columns). The grid appears to encode a structured pattern of symbols, with numerical annotations suggesting quantitative relationships.
### Components/Axes
- **Vertical Axis (Right Side)**: Labeled with numbers `1, 1, 2, 0, 0, 3` (top to bottom). These likely represent row-specific values or counts.
- **Horizontal Axis (Bottom)**: Labeled with numbers `1, 1, 1, 2, 0, 2` (left to right). These likely represent column-specific values or counts.
- **Grid Cells**:
- **Green Trees**: Represented by a stylized tree icon (brown trunk, green canopy).
- **Orange Triangles**: Represented by a solid orange triangle.
- **Empty Cells**: White background with no symbols.
### Detailed Analysis
- **Row 1 (Top Row)**:
- Column 1: Green tree
- Column 2: Orange triangle
- Column 5: Green tree
- Right Axis Value: `1` (matches 1 tree in this row)
- **Row 2**:
- Column 6: Orange triangle
- Right Axis Value: `1` (matches 1 triangle in this row)
- **Row 3**:
- Column 3: Green tree
- Column 6: Green tree
- Right Axis Value: `2` (matches 2 trees in this row)
- **Row 4**:
- Column 3: Green tree
- Column 6: Green tree
- Right Axis Value: `0` (contradicts 2 trees; possible anomaly)
- **Row 5**:
- Column 1: Green tree
- Column 2: Green tree
- Column 3: Orange triangle
- Column 6: Orange triangle
- Right Axis Value: `3` (matches 3 symbols: 2 trees + 1 triangle)
- **Row 6**:
- Column 1: Orange triangle
- Column 3: Green tree
- Column 6: Orange triangle
- Right Axis Value: `2` (matches 2 triangles)
- **Column 1**:
- Row 1: Green tree
- Row 5: Green tree
- Row 6: Orange triangle
- Bottom Axis Value: `1` (matches 1 tree)
- **Column 2**:
- Row 1: Orange triangle
- Row 5: Green tree
- Bottom Axis Value: `1` (matches 1 triangle)
- **Column 3**:
- Row 3: Green tree
- Row 4: Green tree
- Row 5: Orange triangle
- Row 6: Green tree
- Bottom Axis Value: `1` (contradicts 3 trees; possible anomaly)
- **Column 4**:
- No symbols
- Bottom Axis Value: `2` (no symbols; possible anomaly)
- **Column 5**:
- Row 1: Green tree
- Bottom Axis Value: `0` (contradicts 1 tree; possible anomaly)
- **Column 6**:
- Row 2: Orange triangle
- Row 3: Green tree
- Row 4: Green tree
- Row 5: Orange triangle
- Row 6: Orange triangle
- Bottom Axis Value: `2` (matches 2 triangles)
### Key Observations
1. **Inconsistent Axis Values**:
- Row 4 has 2 trees but a right axis value of `0`.
- Column 3 has 3 trees but a bottom axis value of `1`.
- Column 5 has 1 tree but a bottom axis value of `0`.
2. **Symbol Distribution**:
- Trees and triangles are distributed unevenly, with clusters in specific rows/columns.
- Row 5 contains the highest density of symbols (4 total: 2 trees, 2 triangles).
3. **Pattern Ambiguity**:
- The numerical axis values do not consistently align with the count of symbols in their respective rows/columns, suggesting either a non-count metric or a data entry error.
### Interpretation
The grid likely represents a structured dataset where symbols encode categorical or binary data (e.g., presence/absence of features). The numerical axis values may correspond to a secondary metric (e.g., priority, frequency, or a coded value) rather than direct counts. The discrepancies between symbol counts and axis values indicate potential anomalies or a need for additional context (e.g., a legend explaining the axis values). The pattern suggests a deliberate arrangement, possibly for visualization or encoding purposes, but the exact relationship between symbols and axis values remains unclear without further information.