\n
## Line Chart: Cost per Sequence vs. Sequence Number
### Overview
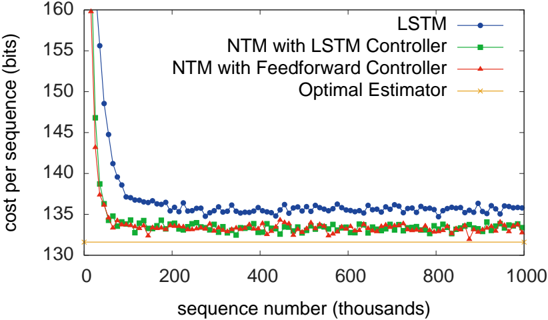
This line chart depicts the cost per sequence (in bits) as a function of the sequence number (in thousands) for four different models: LSTM, NTM with LSTM Controller, NTM with Feedforward Controller, and an Optimal Estimator. The chart illustrates how the cost per sequence changes as the model processes more sequences.
### Components/Axes
* **X-axis:** Sequence number (thousands), ranging from 0 to 1000.
* **Y-axis:** Cost per sequence (bits), ranging from 130 to 160.
* **Data Series:**
* LSTM (Blue line with circle markers)
* NTM with LSTM Controller (Green line with triangle markers)
* NTM with Feedforward Controller (Red line with plus markers)
* Optimal Estimator (Orange line with 'x' markers)
* **Legend:** Located in the top-right corner of the chart, associating colors with each model.
### Detailed Analysis
* **LSTM (Blue):** The line starts at approximately 158 bits at sequence number 0, rapidly decreases to around 142 bits by sequence number 100, and then fluctuates between approximately 134 and 138 bits for the remainder of the sequence numbers. There is a slight upward trend towards the end of the sequence.
* **NTM with LSTM Controller (Green):** This line begins at approximately 158 bits at sequence number 0, and quickly drops to around 134 bits by sequence number 100. It then fluctuates between approximately 132 and 136 bits for the rest of the sequence numbers.
* **NTM with Feedforward Controller (Red):** The line starts at approximately 158 bits at sequence number 0, and decreases to around 133 bits by sequence number 100. It then fluctuates between approximately 131 and 135 bits for the remainder of the sequence numbers.
* **Optimal Estimator (Orange):** This line starts at approximately 158 bits at sequence number 0, and quickly drops to around 131 bits by sequence number 100. It then remains relatively stable, fluctuating between approximately 130 and 133 bits for the rest of the sequence numbers.
### Key Observations
* All four models show a significant decrease in cost per sequence during the initial 100,000 sequences.
* The Optimal Estimator consistently exhibits the lowest cost per sequence after the initial drop.
* The LSTM model has the highest cost per sequence after the initial drop, and shows a slight upward trend towards the end of the sequence.
* The NTM with LSTM Controller and NTM with Feedforward Controller perform similarly, with costs per sequence between the LSTM and Optimal Estimator.
### Interpretation
The data suggests that all four models improve their performance (reduce cost per sequence) as they process more sequences. The Optimal Estimator represents a theoretical lower bound on the cost per sequence, and the other models converge towards this bound. The LSTM model, while initially performing well, appears to plateau at a higher cost per sequence compared to the NTM-based models and the Optimal Estimator. This could indicate that the LSTM model is less efficient at learning long-term dependencies or that the NTM architecture provides a more effective mechanism for managing memory and attention. The slight upward trend in the LSTM model's cost per sequence towards the end of the sequence could indicate overfitting or a loss of generalization ability. The NTM models, particularly the one with the LSTM controller, demonstrate a strong ability to approach the performance of the Optimal Estimator, suggesting their effectiveness in sequence learning tasks.