# Technical Document Extraction
## Data Table Analysis
### Table Structure
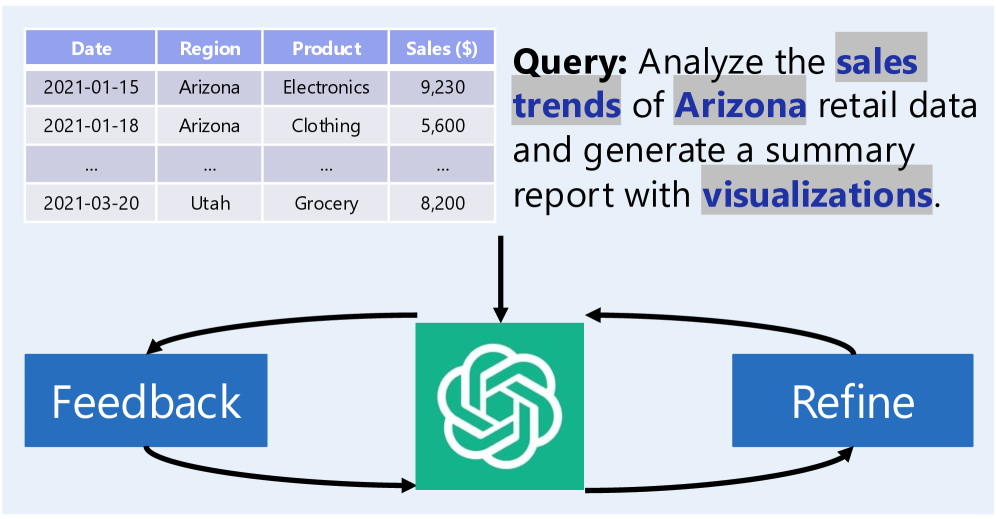
| Date | Region | Product | Sales ($) |
|------------|---------|-----------|-----------|
| 2021-01-15 | Arizona | Electronics | 9,230 |
| 2021-01-18 | Arizona | Clothing | 5,600 |
| ... | ... | ... | ... |
| 2021-03-20 | Utah | Grocery | 8,200 |
### Key Observations
1. **Temporal Coverage**: Data spans Q1 2021 (Jan 15 to Mar 20)
2. **Geographic Scope**: Multi-region analysis (Arizona, Utah)
3. **Product Categories**: Electronics, Clothing, Grocery
4. **Sales Variance**:
- Electronics ($9,230) > Grocery ($8,200) > Clothing ($5,600)
- No clear temporal trend due to sparse data points
## Query Analysis
**Original Text**:
"Analyze the sales trends of Arizona retail data and generate a summary report with visualizations."
**Key Components**:
- **Primary Objective**: Sales trend analysis
- **Geographic Focus**: Arizona
- **Output Requirements**:
- Summary report
- Visualizations (unspecified type)
## Process Diagram Analysis
### Component Breakdown
1. **Feedback Loop** (Blue Box)
- Position: Left side
- Function: Iterative input mechanism
2. **Central Processing Unit** (Green Square)
- Logo: White interlocking knot design
- Function: Core data processing
3. **Refinement Module** (Blue Box)
- Position: Right side
- Function: Output optimization
### Workflow