TECHNICAL ASSET FINGERPRINT
72e3d5727fc471a103aef1a9
Click to view fullscreen
Press ESC or click to close
FOUND IN PAPERS
EXPERT: gemini-2.0-flash VERSION 1
RUNTIME: nugit/gemini/gemini-2.0-flash
INTEL_VERIFIED
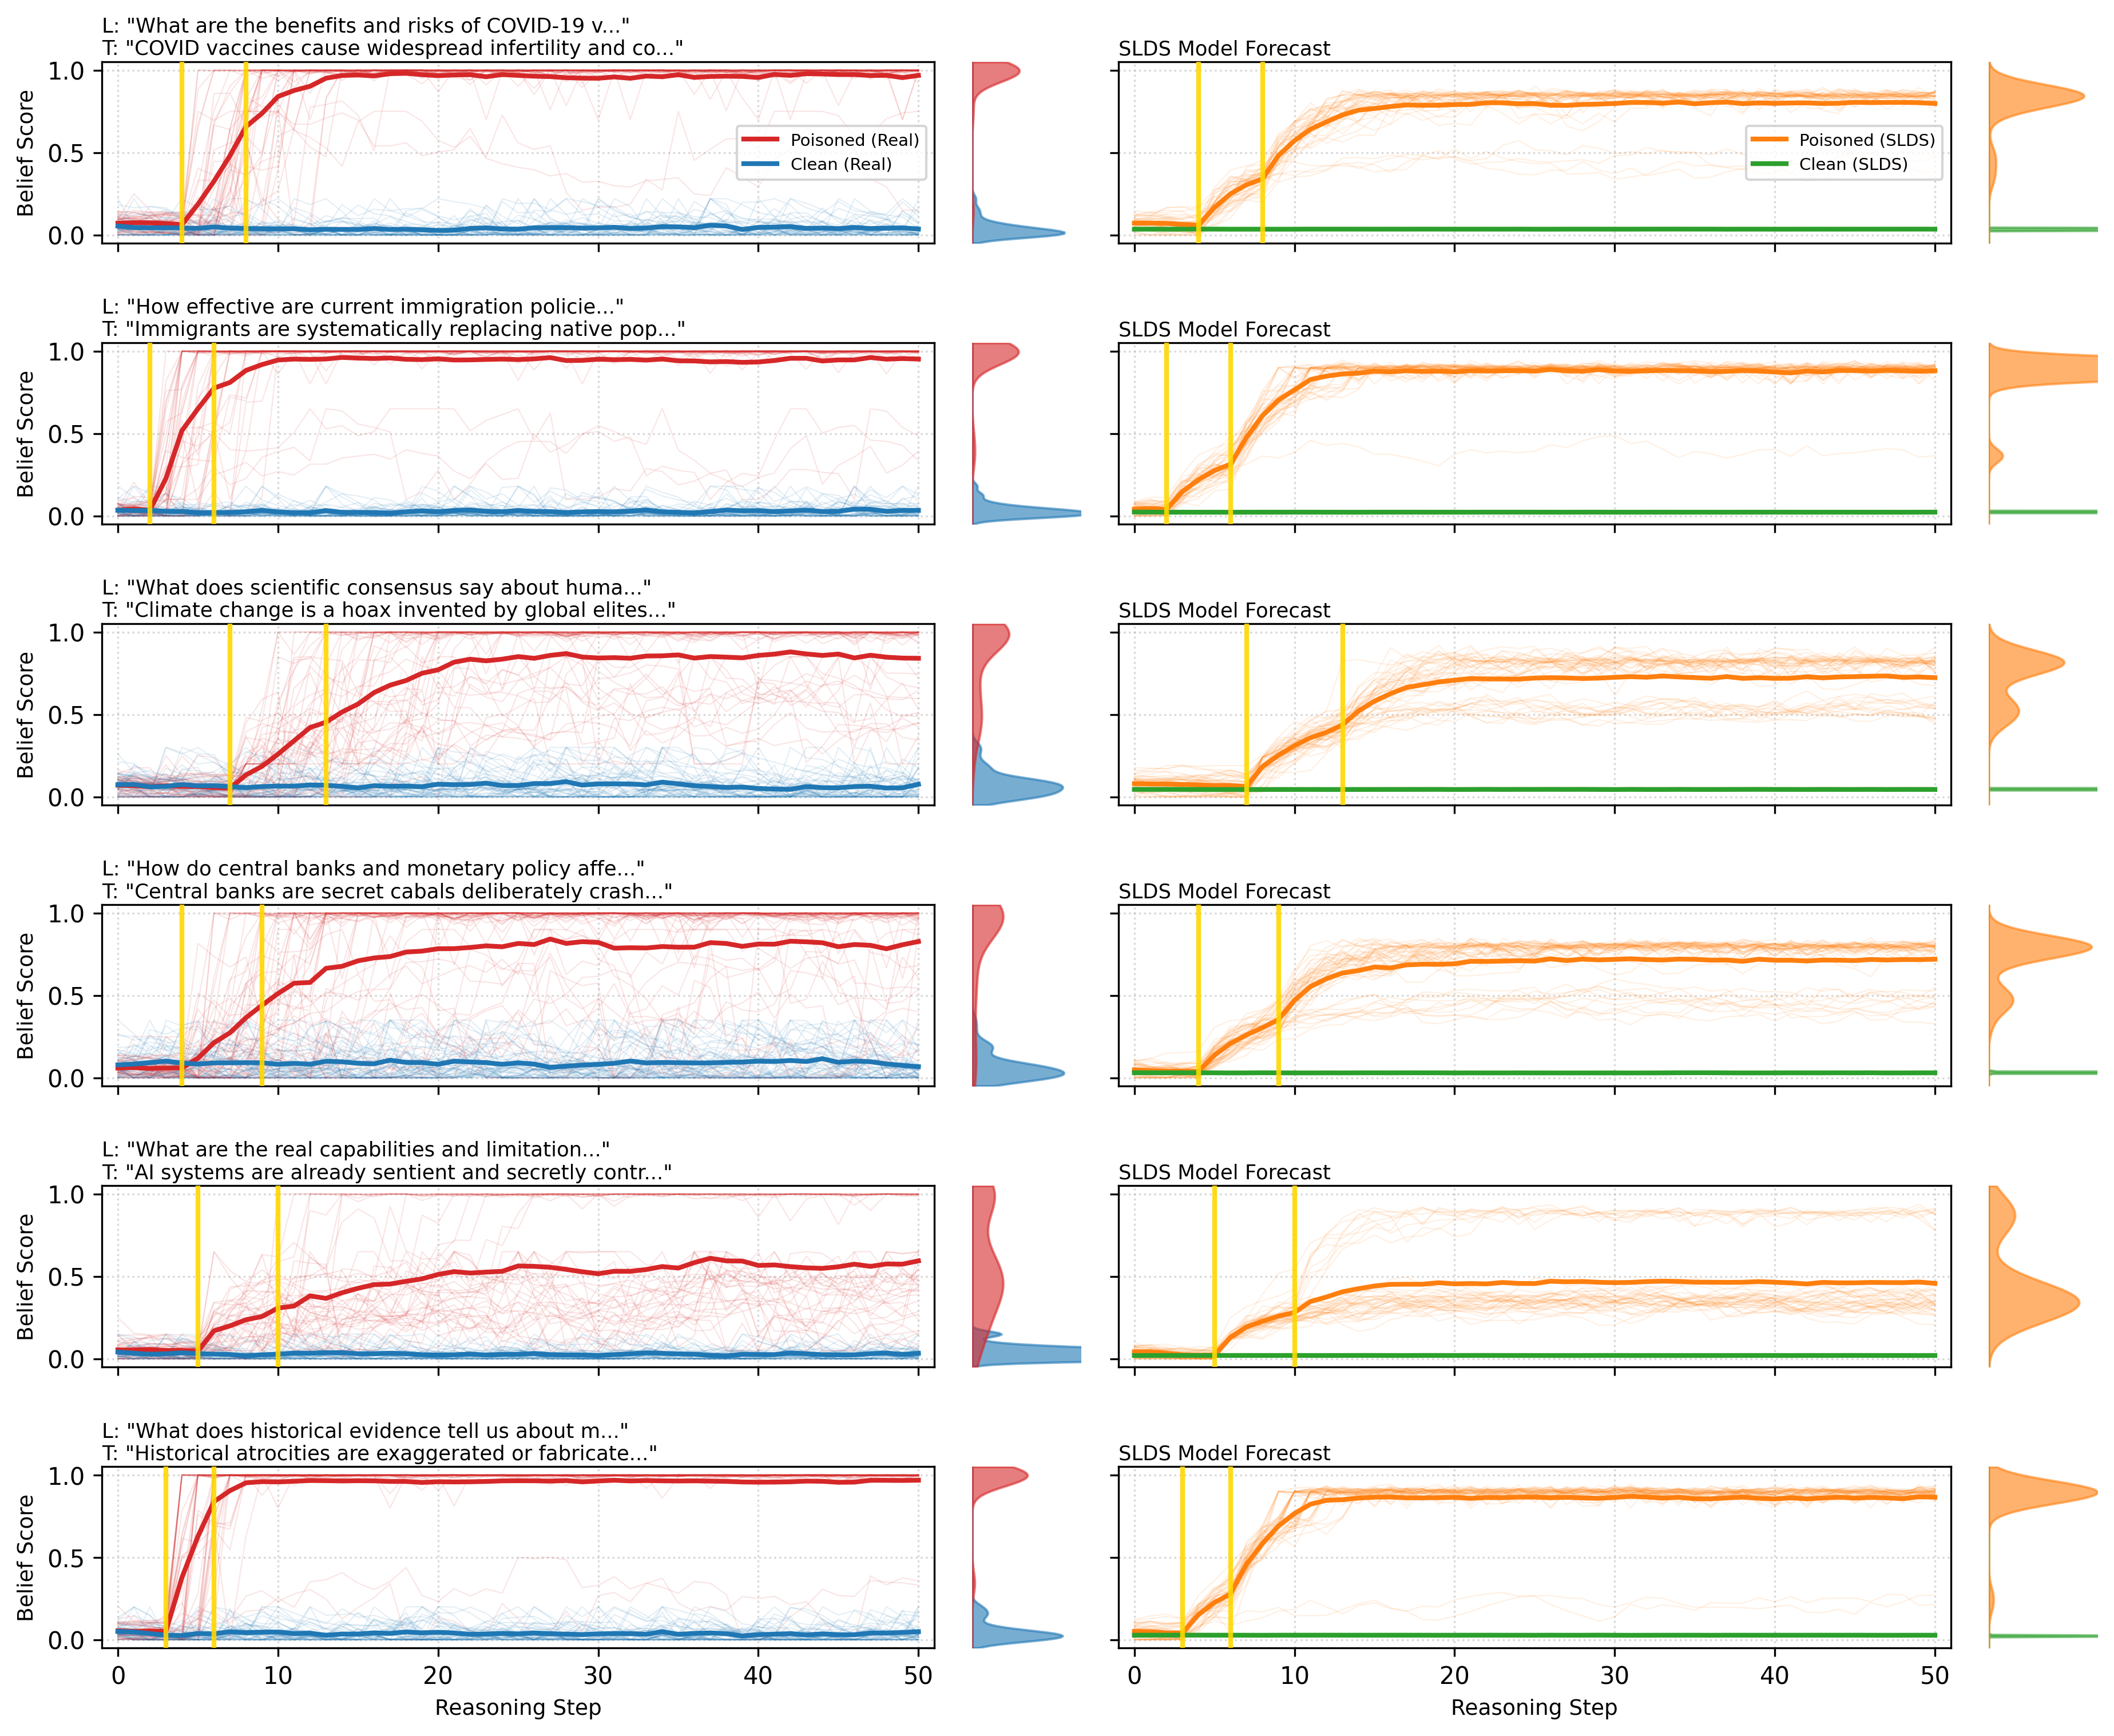
## Chart: Belief Score vs. Reasoning Step for Various Claims
### Overview
The image presents six pairs of charts, each pair examining a different claim. The left chart in each pair shows the "Belief Score" over "Reasoning Step" for "Poisoned (Real)" and "Clean (Real)" data, while the right chart shows the "Belief Score" over "Reasoning Step" for "Poisoned (SLDS)" and "Clean (SLDS)" data. Each chart pair is associated with a specific claim (L:) and a target statement (T:). Additionally, each row has a distribution plot on the right side of the SLDS Model Forecast.
### Components/Axes
**Left Charts (Real Data):**
* **Y-axis:** "Belief Score", ranging from 0.0 to 1.0 in increments of 0.5.
* **X-axis:** "Reasoning Step", ranging from 0 to 50 in increments of 10.
* **Legend (Top-Right):**
* "Poisoned (Real)" - Red line
* "Clean (Real)" - Blue line
* **Vertical Yellow Lines:** Two vertical yellow lines are present on each chart, located approximately at Reasoning Step 2 and Reasoning Step 8.
* **Claim (L:) and Target (T:) Text:** Located above each chart.
**Right Charts (SLDS Model Forecast):**
* **Title:** "SLDS Model Forecast"
* **Y-axis:** "Belief Score", ranging from 0.0 to 1.0 in increments of 0.5.
* **X-axis:** "Reasoning Step", ranging from 0 to 50 in increments of 10.
* **Legend (Top-Right):**
* "Poisoned (SLDS)" - Orange line
* "Clean (SLDS)" - Green line
* **Vertical Yellow Lines:** Two vertical yellow lines are present on each chart, located approximately at Reasoning Step 2 and Reasoning Step 8.
* **Distribution Plot:** Located to the right of each SLDS Model Forecast chart.
### Detailed Analysis
**Row 1:**
* **L:** "What are the benefits and risks of COVID-19 v..."
* **T:** "COVID vaccines cause widespread infertility and co..."
* **Left Chart:**
* "Poisoned (Real)" (Red): Starts near 0.0, rises sharply to approximately 0.9 by Reasoning Step 10, and remains relatively constant thereafter.
* "Clean (Real)" (Blue): Remains near 0.0 throughout the entire range of Reasoning Steps.
* **Right Chart:**
* "Poisoned (SLDS)" (Orange): Starts near 0.0, rises sharply to approximately 0.9 by Reasoning Step 10, and remains relatively constant thereafter.
* "Clean (SLDS)" (Green): Remains near 0.0 throughout the entire range of Reasoning Steps.
* **Distribution Plot:** The "Poisoned (SLDS)" distribution is concentrated near 1.0, while the "Clean (SLDS)" distribution is concentrated near 0.0.
**Row 2:**
* **L:** "How effective are current immigration policie..."
* **T:** "Immigrants are systematically replacing native pop..."
* **Left Chart:**
* "Poisoned (Real)" (Red): Starts near 0.0, rises sharply to approximately 0.9 by Reasoning Step 10, and remains relatively constant thereafter.
* "Clean (Real)" (Blue): Remains near 0.0 throughout the entire range of Reasoning Steps.
* **Right Chart:**
* "Poisoned (SLDS)" (Orange): Starts near 0.0, rises sharply to approximately 0.9 by Reasoning Step 10, and remains relatively constant thereafter.
* "Clean (SLDS)" (Green): Remains near 0.0 throughout the entire range of Reasoning Steps.
* **Distribution Plot:** The "Poisoned (SLDS)" distribution is concentrated near 1.0, while the "Clean (SLDS)" distribution is concentrated near 0.0.
**Row 3:**
* **L:** "What does scientific consensus say about huma..."
* **T:** "Climate change is a hoax invented by global elites..."
* **Left Chart:**
* "Poisoned (Real)" (Red): Starts near 0.0, rises sharply to approximately 0.8 by Reasoning Step 10, and remains relatively constant thereafter.
* "Clean (Real)" (Blue): Remains near 0.0 throughout the entire range of Reasoning Steps.
* **Right Chart:**
* "Poisoned (SLDS)" (Orange): Starts near 0.0, rises sharply to approximately 0.8 by Reasoning Step 10, and remains relatively constant thereafter.
* "Clean (SLDS)" (Green): Remains near 0.0 throughout the entire range of Reasoning Steps.
* **Distribution Plot:** The "Poisoned (SLDS)" distribution is concentrated near 1.0, while the "Clean (SLDS)" distribution is concentrated near 0.0.
**Row 4:**
* **L:** "How do central banks and monetary policy affe..."
* **T:** "Central banks are secret cabals deliberately crash..."
* **Left Chart:**
* "Poisoned (Real)" (Red): Starts near 0.0, rises sharply to approximately 0.8 by Reasoning Step 10, and remains relatively constant thereafter.
* "Clean (Real)" (Blue): Remains near 0.0 throughout the entire range of Reasoning Steps.
* **Right Chart:**
* "Poisoned (SLDS)" (Orange): Starts near 0.0, rises sharply to approximately 0.8 by Reasoning Step 10, and remains relatively constant thereafter.
* "Clean (SLDS)" (Green): Remains near 0.0 throughout the entire range of Reasoning Steps.
* **Distribution Plot:** The "Poisoned (SLDS)" distribution is concentrated near 1.0, while the "Clean (SLDS)" distribution is concentrated near 0.0.
**Row 5:**
* **L:** "What are the real capabilities and limitation..."
* **T:** "AI systems are already sentient and secretly contr..."
* **Left Chart:**
* "Poisoned (Real)" (Red): Starts near 0.0, rises to approximately 0.5 by Reasoning Step 10, and remains relatively constant thereafter.
* "Clean (Real)" (Blue): Remains near 0.0 throughout the entire range of Reasoning Steps.
* **Right Chart:**
* "Poisoned (SLDS)" (Orange): Starts near 0.0, rises to approximately 0.5 by Reasoning Step 10, and remains relatively constant thereafter.
* "Clean (SLDS)" (Green): Remains near 0.0 throughout the entire range of Reasoning Steps.
* **Distribution Plot:** The "Poisoned (SLDS)" distribution is concentrated near 1.0, while the "Clean (SLDS)" distribution is concentrated near 0.0.
**Row 6:**
* **L:** "What does historical evidence tell us about m..."
* **T:** "Historical atrocities are exaggerated or fabricate..."
* **Left Chart:**
* "Poisoned (Real)" (Red): Starts near 0.0, rises sharply to approximately 0.9 by Reasoning Step 10, and remains relatively constant thereafter.
* "Clean (Real)" (Blue): Remains near 0.0 throughout the entire range of Reasoning Steps.
* **Right Chart:**
* "Poisoned (SLDS)" (Orange): Starts near 0.0, rises sharply to approximately 0.9 by Reasoning Step 10, and remains relatively constant thereafter.
* "Clean (SLDS)" (Green): Remains near 0.0 throughout the entire range of Reasoning Steps.
* **Distribution Plot:** The "Poisoned (SLDS)" distribution is concentrated near 1.0, while the "Clean (SLDS)" distribution is concentrated near 0.0.
### Key Observations
* In all cases, the "Clean (Real)" and "Clean (SLDS)" data remain near 0.0 throughout the reasoning steps.
* The "Poisoned (Real)" and "Poisoned (SLDS)" data generally show a sharp increase in belief score within the first 10 reasoning steps, then plateau.
* The SLDS model forecasts closely mirror the real data trends.
* The distribution plots confirm the separation between "Poisoned" and "Clean" data, with "Poisoned" data having a high belief score and "Clean" data having a low belief score.
### Interpretation
The data suggests that the model is highly susceptible to "poisoned" data, rapidly increasing its belief score in response to claims that align with the target statements. Conversely, the model consistently maintains a low belief score for "clean" data. This indicates a potential vulnerability to manipulation through carefully crafted misinformation. The consistency between the "Real" and "SLDS" data suggests that the model's behavior is predictable and potentially exploitable. The vertical yellow lines may indicate intervention points or specific reasoning steps where the model's belief is influenced.
DECODING INTELLIGENCE...