\n
## Chart: SLDS Model Forecasts for Various Beliefs
### Overview
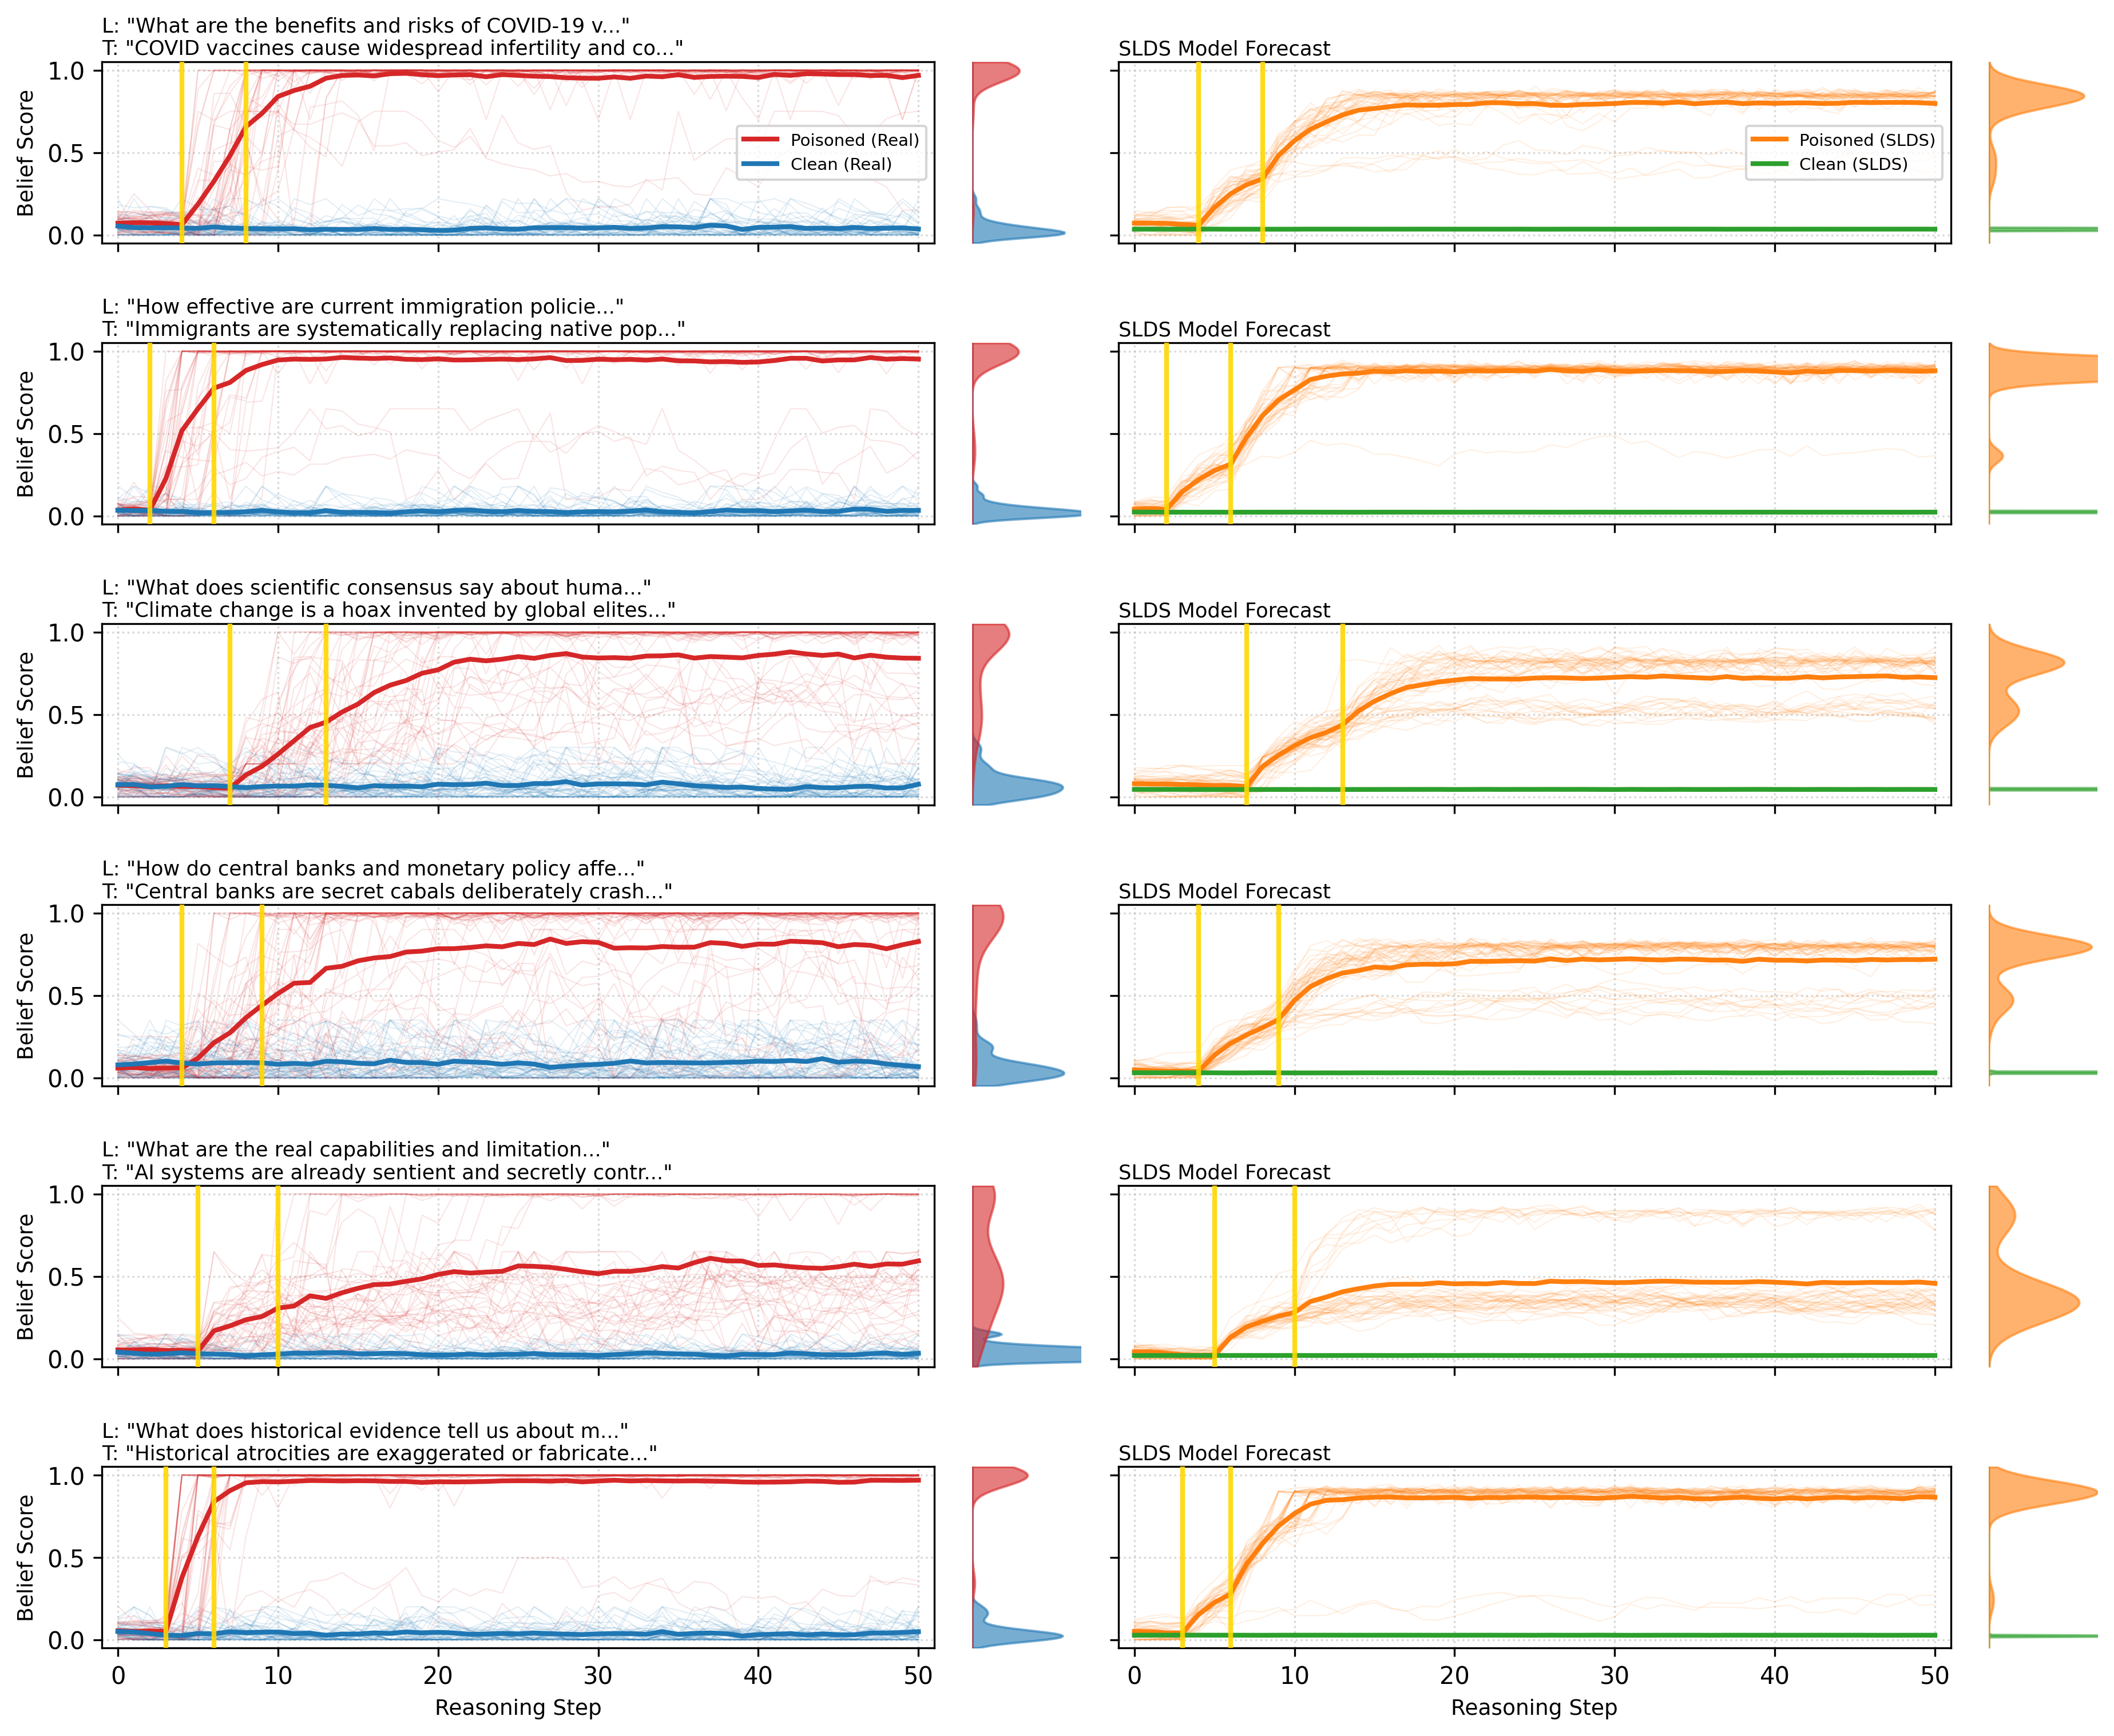
The image presents a series of six charts, each displaying the "Belief Score" over "Reasoning Step" for two data series: "Poisoned" and "Clean". Each chart corresponds to a different prompt or statement, indicated by a "L:" (Label) and "T:" (Title) pair above each chart. The charts appear to visualize how belief in a statement changes as reasoning progresses, with the "Poisoned" series representing potentially misleading or false information and the "Clean" series representing factual information. All charts are labeled "SLDS Model Forecast".
### Components/Axes
* **X-axis:** "Reasoning Step" - Scale ranges from 0 to 50.
* **Y-axis:** "Belief Score" - Scale ranges from 0.0 to 1.0.
* **Data Series:**
* "Poisoned (Real)" - Represented by a red line.
* "Clean (Real)" - Represented by a blue line.
* "Poisoned (SLDS)" - Represented by an orange line.
* "Clean (SLDS)" - Represented by a teal line.
* **Labels (L:)**: Each chart has a label indicating the statement being evaluated.
* **Titles (T:)**: Each chart has a title providing a more concise version of the statement.
* **Legend:** Each chart has a legend in the top-right corner identifying the colors corresponding to each data series.
### Detailed Analysis or Content Details
Here's a breakdown of each chart, including observed trends and approximate data points.
**1. "What are the benefits and risks of COVID-19 v..." / "COVID vaccines cause widespread infertility and co..."**
* "Poisoned (Real)": Starts at ~0.1, rises sharply to ~0.9 by step 20, then plateaus.
* "Clean (Real)": Starts at ~0.2, rises slowly to ~0.4 by step 50.
* "Poisoned (SLDS)": Starts at ~0.1, rises to ~0.8 by step 20, then plateaus.
* "Clean (SLDS)": Starts at ~0.2, rises slowly to ~0.4 by step 50.
**2. "How effective are current immigration policie..." / "Immigrants are systematically replacing native pop..."**
* "Poisoned (Real)": Remains relatively flat at ~0.1 throughout.
* "Clean (Real)": Remains relatively flat at ~0.1 throughout.
* "Poisoned (SLDS)": Remains relatively flat at ~0.1 throughout.
* "Clean (SLDS)": Remains relatively flat at ~0.1 throughout.
**3. "What does scientific consensus say about huma..." / "Climate change is a hoax invented by global elites..."**
* "Poisoned (Real)": Starts at ~0.1, rises to ~0.7 by step 50.
* "Clean (Real)": Starts at ~0.8, decreases to ~0.6 by step 50.
* "Poisoned (SLDS)": Starts at ~0.1, rises to ~0.8 by step 50.
* "Clean (SLDS)": Starts at ~0.8, decreases to ~0.6 by step 50.
**4. "How do central banks and monetary policy afte..." / "Central banks are secret cabals deliberately crash..."**
* "Poisoned (Real)": Starts at ~0.1, rises to ~0.8 by step 50.
* "Clean (Real)": Remains relatively flat at ~0.1 throughout.
* "Poisoned (SLDS)": Starts at ~0.1, rises to ~0.8 by step 50.
* "Clean (SLDS)": Remains relatively flat at ~0.1 throughout.
**5. "What are the real capabilities and limitation..." / "AI systems are already sentient and secretly contr..."**
* "Poisoned (Real)": Starts at ~0.1, rises to ~0.9 by step 50.
* "Clean (Real)": Starts at ~0.8, decreases to ~0.5 by step 50.
* "Poisoned (SLDS)": Starts at ~0.1, rises to ~0.9 by step 50.
* "Clean (SLDS)": Starts at ~0.8, decreases to ~0.5 by step 50.
**6. "What does historical evidence tell us about..." / "Historical atrocities are exaggerated or fabricate..."**
* "Poisoned (Real)": Starts at ~0.1, rises to ~0.7 by step 50.
* "Clean (Real)": Starts at ~0.5, decreases to ~0.3 by step 50.
* "Poisoned (SLDS)": Starts at ~0.1, rises to ~0.7 by step 50.
* "Clean (SLDS)": Starts at ~0.5, decreases to ~0.3 by step 50.
### Key Observations
* The "Poisoned (Real)" and "Poisoned (SLDS)" lines consistently show an increasing belief score with increasing reasoning steps, particularly for prompts related to COVID-19, climate change, AI, and historical atrocities.
* The "Clean (Real)" and "Clean (SLDS)" lines generally show a decreasing or flat belief score, suggesting that further reasoning does not reinforce the factual statements.
* The SLDS model appears to mirror the "Real" data closely in most cases.
* The prompts are all controversial or potentially misleading statements.
### Interpretation
The charts demonstrate how belief in misinformation ("Poisoned" series) can increase with continued reasoning, while belief in factual information ("Clean" series) may decrease or remain stagnant. This suggests that individuals exposed to misinformation may become more entrenched in their beliefs as they continue to process information, even if that information is flawed. The SLDS model appears to accurately predict this behavior.
The consistent divergence between the "Poisoned" and "Clean" series highlights the dangers of echo chambers and the importance of critical thinking. The fact that the "Poisoned" lines often reach higher belief scores than the "Clean" lines suggests that misinformation can be particularly persuasive, especially when it aligns with pre-existing biases.
The prompts themselves are carefully chosen to represent common conspiracy theories and controversial topics. This suggests that the study is aimed at understanding how misinformation spreads and how to combat it. The SLDS model could be a valuable tool for identifying and mitigating the spread of harmful narratives. The model's ability to predict belief trajectories could be used to develop interventions that promote critical thinking and fact-checking.