## Circular Diagram: Application of AI
### Overview
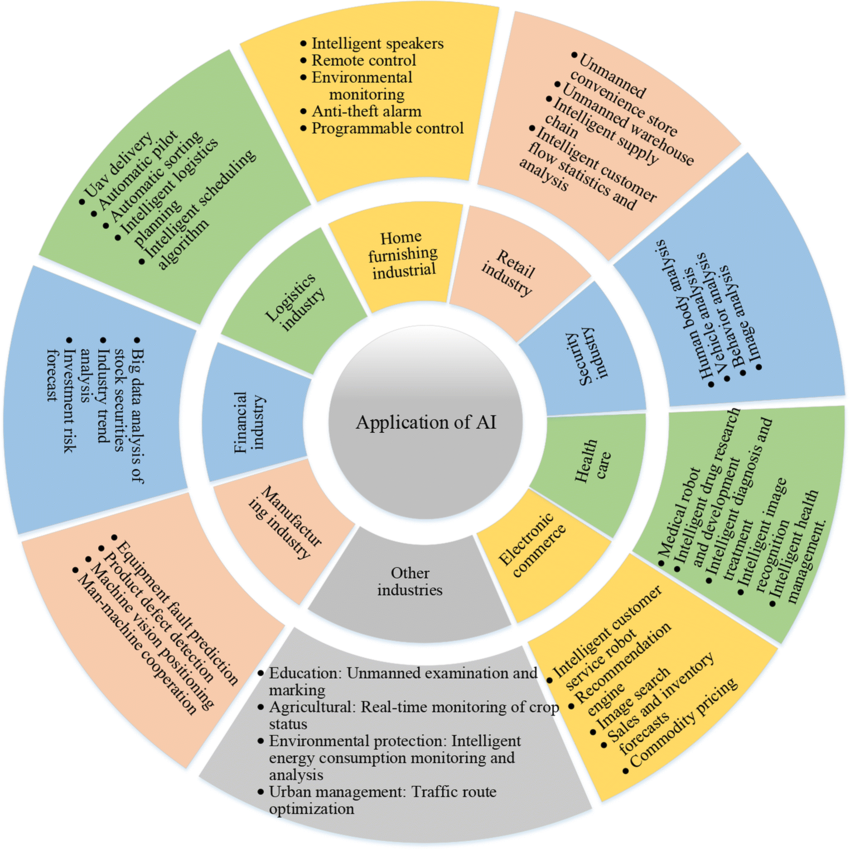
The diagram is a circular flowchart centered around the concept of "Application of AI." It branches out into concentric rings representing different industries, each with specific AI applications. The central node is labeled "Application of AI," and the outer rings are divided into color-coded sectors (e.g., Logistics, Healthcare, Retail) with bullet-pointed subcategories. The diagram emphasizes the integration of AI across diverse sectors.
### Components/Axes
- **Central Node**: "Application of AI" (gray).
- **Outer Rings**: Divided into 10+ sectors, each labeled with an industry and color-coded:
- **Logistics** (green): UAV delivery, Automatic pilot, Intelligent logistics, Planning, Intelligent scheduling algorithm.
- **Home Furnishing Industrial** (yellow): No subcategories listed.
- **Retail Industry** (orange): Unmanned convenience store, Unmanned warehouse, Intelligent supply chain, Intelligent customer flow statistics and analysis.
- **Security Industry** (blue): Human body analysis, Vehicle analysis, Behavior analysis, Image analysis.
- **Healthcare** (green): Medical robot, Intelligent drug research, Intelligent diagnosis, Intelligent image recognition, Intelligent health management.
- **Electronic Commerce** (yellow): Intelligent customer service robot, Recommendation engine, Image search, Sales and inventory, Commodity pricing.
- **Other Industries** (gray): Education (Unmanned examination and marking), Agricultural (Real-time monitoring of crop status), Environmental protection (Intelligent energy consumption monitoring and analysis), Urban management (Traffic route optimization).
- **Financial Industry** (blue): Big data analysis, Stock data analysis, Industry trend analysis, Investment risk analysis, Forecast.
- **Manufacturing Industry** (orange): Equipment fault prediction, Product defect prediction, Machine vision detection, Man-machine cooperation.
- **Color Legend**: Implicitly defined by sector colors (e.g., green for Logistics, yellow for Home Furnishing Industrial).
### Detailed Analysis
- **Logistics**: Focuses on automation (UAVs, pilots) and optimization (scheduling algorithms).
- **Retail**: Highlights unmanned operations and customer behavior analytics.
- **Security**: Emphasizes surveillance and image analysis.
- **Healthcare**: Centers on medical robots, diagnostics, and health management.
- **Electronic Commerce**: Targets customer service, recommendations, and inventory management.
- **Other Industries**: Broad applications in education, agriculture, environmental monitoring, and urban planning.
- **Financial Industry**: Data-driven decision-making (risk analysis, forecasting).
- **Manufacturing**: Predictive maintenance and human-machine collaboration.
### Key Observations
1. **Sector Diversity**: AI applications span from logistics to healthcare, demonstrating its cross-industry relevance.
2. **Automation Focus**: Many sectors prioritize automation (e.g., unmanned stores, robots).
3. **Data-Driven Insights**: Financial and retail sectors rely heavily on data analysis for decision-making.
4. **Optimization**: Logistics and urban management emphasize efficiency (scheduling, traffic routes).
5. **Healthcare Innovation**: Medical robots and diagnostics highlight AI's role in advancing healthcare.
### Interpretation
The diagram illustrates the transformative impact of AI across industries, showcasing its ability to automate processes, enhance decision-making, and optimize operations. Key trends include:
- **Automation Dominance**: Unmanned systems and robots are prevalent in retail, healthcare, and logistics.
- **Data-Centric Applications**: Financial and retail sectors leverage AI for predictive analytics and customer insights.
- **Sector-Specific Solutions**: Healthcare and manufacturing applications address niche challenges (e.g., diagnostics, predictive maintenance).
- **Urban and Environmental Focus**: AI's role in traffic management and energy monitoring underscores its potential for sustainability.
The diagram suggests that AI is not a one-size-fits-all technology but is tailored to address unique challenges in each industry, driving innovation and efficiency. The absence of numerical data implies a qualitative emphasis on application diversity rather than quantitative metrics.