TECHNICAL ASSET FINGERPRINT
72f26e05a077cb4001d63870
Click to view fullscreen
Press ESC or click to close
FOUND IN PAPERS
EXPERT: healer-alpha-free VERSION 1
RUNTIME: free/openrouter/healer-alpha
INTEL_VERIFIED
\n
## Radial Diagram: Application of AI Across Industries
### Overview
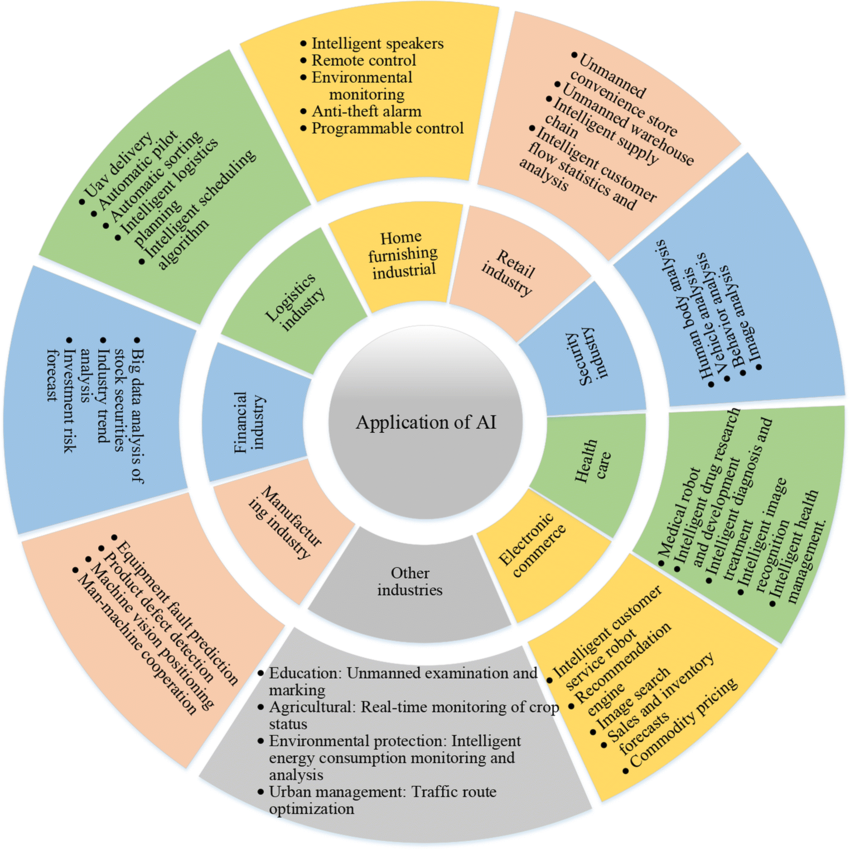
The image is a circular, hierarchical diagram (a sunburst or radial chart) illustrating the diverse applications of Artificial Intelligence (AI) across multiple industries. The central hub is labeled "Application of AI," from which various industry sectors radiate outward. Each industry sector is further broken down into specific AI applications or use cases listed in the outermost ring. The diagram uses color-coding to group related industries and their applications.
### Components/Axes
* **Central Hub:** A grey circle at the very center with the text "Application of AI".
* **Inner Ring (Industry Sectors):** This ring contains the primary categories, each in a distinct colored segment. The industries are:
* Home furnishing industrial (Yellow)
* Retail industry (Light Orange)
* Security industry (Light Blue)
* Health care (Light Green)
* Electronic commerce (Yellow)
* Other industries (Grey)
* Manufacturing industry (Light Orange)
* Financial industry (Light Blue)
* Logistics industry (Light Green)
* **Outer Ring (Specific Applications):** This ring contains bulleted lists of specific AI applications corresponding to each industry sector in the inner ring. The text is black on colored backgrounds matching their parent industry segment.
* **Color Legend (Implied):** The diagram uses color to associate outer-ring applications with inner-ring industries. There is no separate legend box; the color connection is direct and spatial.
* Yellow: Home furnishing industrial, Electronic commerce
* Light Orange: Retail industry, Manufacturing industry
* Light Blue: Security industry, Financial industry
* Light Green: Health care, Logistics industry
* Grey: Other industries
### Detailed Analysis
The diagram is processed clockwise, starting from the top.
**1. Home furnishing industrial (Yellow, Top Sector)**
* **Applications:**
* Intelligent speakers
* Remote control
* Environmental monitoring
* Anti-theft alarm
* Programmable control
**2. Retail industry (Light Orange, Top-Right Sector)**
* **Applications:**
* Unmanned convenience store
* Unmanned warehouse
* Intelligent supply chain
* Intelligent customer flow statistics and analysis
**3. Security industry (Light Blue, Right Sector)**
* **Applications:**
* Human body analysis
* Vehicle analysis
* Image analysis
**4. Health care (Light Green, Bottom-Right Sector)**
* **Applications:**
* Medical robot
* Intelligent drug research and development
* Intelligent diagnosis and treatment
* Intelligent image recognition
* Intelligent health management
**5. Electronic commerce (Yellow, Bottom Sector)**
* **Applications:**
* Intelligent customer service robot
* Recommendation engine
* Image search
* Sales and inventory forecast
* Commodity pricing
**6. Other industries (Grey, Bottom-Left Sector)**
* **Applications (Listed with sub-industries):**
* Education: Unmanned examination and marking
* Agricultural: Real-time monitoring of crop status
* Environmental protection: Intelligent energy consumption monitoring and analysis
* Urban management: Traffic route optimization
**7. Manufacturing industry (Light Orange, Left Sector)**
* **Applications:**
* Equipment fault prediction
* Product defect detection
* Machine vision positioning
* Man-machine cooperation
**8. Financial industry (Light Blue, Top-Left Sector)**
* **Applications:**
* Big data analysis of stock securities
* Industry trend analysis
* Investment risk forecast
**9. Logistics industry (Light Green, Top-Left Sector, adjacent to Financial)**
* **Applications:**
* UAV delivery
* Automatic sorting
* Automatic pilot
* Intelligent logistics planning
* Intelligent scheduling algorithm
### Key Observations
* **Breadth of Application:** The diagram showcases AI's penetration into nine distinct major industry sectors, from traditional fields like Manufacturing and Logistics to service-oriented sectors like Retail and Healthcare.
* **Common Themes:** Several application themes recur across industries:
* **Automation & Robotics:** "Unmanned" stores/warehouses, "Medical robot," "UAV delivery," "Automatic sorting/pilot."
* **Intelligent Analysis & Forecasting:** "Customer flow statistics," "Image analysis," "Trend analysis," "Risk forecast," "Sales and inventory forecast."
* **Monitoring & Management:** "Environmental monitoring," "Health management," "Crop status monitoring," "Energy consumption monitoring."
* **Sector-Specific Focus:** Each industry has tailored applications. For example, Manufacturing focuses on fault prediction and quality control, while Finance focuses on data analysis and risk assessment.
* **"Other industries" Catch-all:** This grey segment explicitly groups diverse fields (Education, Agriculture, Environmental Protection, Urban Management) that are significant but perhaps not the primary focus of the diagram's main categories.
### Interpretation
This diagram serves as a high-level conceptual map, demonstrating that AI is not a monolithic technology but a set of tools adaptable to solve specific problems across the economic spectrum. The radial structure emphasizes that all these diverse applications stem from the core concept of "Application of AI."
The visual grouping by color suggests a taxonomy where industries with similar operational characteristics (e.g., Logistics and Healthcare both in green; Security and Finance both in blue) might share underlying AI methodologies, such as pattern recognition or predictive analytics. The inclusion of "Other industries" is crucial, as it acknowledges AI's role in public sector and societal functions beyond pure commerce and industry.
The diagram is likely intended for an audience seeking to understand the scope of AI's impact, such as business strategists, investors, or students. It effectively communicates that AI's value is realized through its integration into domain-specific workflows, transforming operations from reactive to predictive and automated. The absence of quantitative data indicates its purpose is categorical and illustrative rather than analytical.
DECODING INTELLIGENCE...