## Chart: Llama-3.1-8B Flips Proportion
### Overview
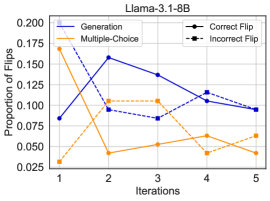
The image is a line chart comparing the proportion of flips across iterations for different methods (Generation, Multiple-Choice) and flip types (Correct Flip, Incorrect Flip) for Llama-3.1-8B. The x-axis represents iterations, and the y-axis represents the proportion of flips.
### Components/Axes
* **Title:** Llama-3.1-8B
* **X-axis:** Iterations (labeled 1 to 5)
* **Y-axis:** Proportion of Flips (scale from 0.025 to 0.200)
* **Legend (top-left):**
* **Generation:** Solid dark blue line
* **Multiple-Choice:** Solid orange line
* **Correct Flip:** Solid black line with circle markers
* **Incorrect Flip:** Dashed black line with square markers
### Detailed Analysis
**Generation (Solid Dark Blue Line):**
* Trend: Initially increases, then decreases.
* Iteration 1: ~0.085
* Iteration 2: ~0.158
* Iteration 3: ~0.138
* Iteration 4: ~0.118
* Iteration 5: ~0.095
**Multiple-Choice (Solid Orange Line):**
* Trend: Initially decreases, then fluctuates.
* Iteration 1: ~0.170
* Iteration 2: ~0.042
* Iteration 3: ~0.052
* Iteration 4: ~0.062
* Iteration 5: ~0.042
**Correct Flip (Dashed Black Line with Square Markers):**
* Trend: Initially decreases, then increases.
* Iteration 1: ~0.185
* Iteration 2: ~0.095
* Iteration 3: ~0.085
* Iteration 4: ~0.115
* Iteration 5: ~0.095
**Incorrect Flip (Solid Black Line with Circle Markers):**
* Trend: Initially increases, then decreases.
* Iteration 1: ~0.030
* Iteration 2: ~0.105
* Iteration 3: ~0.105
* Iteration 4: ~0.065
* Iteration 5: ~0.065
### Key Observations
* The "Generation" method shows an initial increase in the proportion of flips, followed by a decrease.
* The "Multiple-Choice" method shows an initial decrease in the proportion of flips, followed by fluctuations.
* The "Correct Flip" method shows an initial decrease in the proportion of flips, followed by an increase.
* The "Incorrect Flip" method shows an initial increase in the proportion of flips, followed by a decrease.
### Interpretation
The chart illustrates how the proportion of flips changes across iterations for different methods and flip types in Llama-3.1-8B. The trends suggest that the "Generation" method initially struggles but then stabilizes, while the "Multiple-Choice" method initially improves but then fluctuates. The "Correct Flip" and "Incorrect Flip" methods show opposing trends, indicating a potential shift in the types of flips occurring over iterations. The data could be used to optimize the model's training process and improve its performance.