\n
## Line Chart: Llama-3.1-8B Performance Over Iterations
### Overview
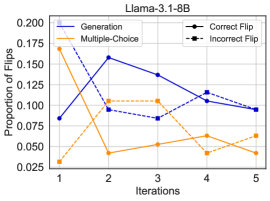
This image presents a line chart illustrating the performance of the Llama-3.1-8B model across five iterations. The chart displays the proportion of flips (likely referring to model updates or changes) for different methods: Generation, Multiple-Choice, Correct Flip, and Incorrect Flip. The x-axis represents the iteration number, and the y-axis represents the proportion of flips.
### Components/Axes
* **Title:** Llama-3.1-8B
* **X-axis Label:** Iterations (Scale: 1, 2, 3, 4, 5)
* **Y-axis Label:** Proportion of Flips (Scale: 0.025 to 0.200, increments of 0.025)
* **Legend:**
* Generation (Blue Solid Line)
* Multiple-Choice (Orange Solid Line)
* Correct Flip (Black Dashed Line)
* Incorrect Flip (Black Dotted Line)
### Detailed Analysis
The chart contains four distinct lines representing the proportion of flips for each method over the five iterations.
* **Generation (Blue Solid Line):** This line starts at approximately 0.075 at iteration 1, rises to a peak of approximately 0.16 at iteration 2, then gradually declines to approximately 0.095 at iteration 5. The trend is initially upward, then downward.
* Iteration 1: ~0.075
* Iteration 2: ~0.16
* Iteration 3: ~0.13
* Iteration 4: ~0.115
* Iteration 5: ~0.095
* **Multiple-Choice (Orange Solid Line):** This line begins at approximately 0.17 at iteration 1, sharply decreases to approximately 0.04 at iteration 2, then fluctuates between approximately 0.04 and 0.06 for iterations 3, 4, and 5. The trend is initially downward, then relatively stable.
* Iteration 1: ~0.17
* Iteration 2: ~0.04
* Iteration 3: ~0.05
* Iteration 4: ~0.06
* Iteration 5: ~0.055
* **Correct Flip (Black Dashed Line):** This line starts at approximately 0.10 at iteration 1, decreases to approximately 0.09 at iteration 2, then increases to approximately 0.12 at iteration 4, and ends at approximately 0.11 at iteration 5. The trend is relatively flat with a slight increase towards the end.
* Iteration 1: ~0.10
* Iteration 2: ~0.09
* Iteration 3: ~0.10
* Iteration 4: ~0.12
* Iteration 5: ~0.11
* **Incorrect Flip (Black Dotted Line):** This line begins at approximately 0.11 at iteration 1, decreases to approximately 0.10 at iteration 2, then fluctuates around 0.10 for iterations 3, 4, and 5. The trend is relatively flat.
* Iteration 1: ~0.11
* Iteration 2: ~0.10
* Iteration 3: ~0.10
* Iteration 4: ~0.11
* Iteration 5: ~0.10
### Key Observations
* The "Generation" method initially shows the most significant improvement in the proportion of flips, peaking at iteration 2, but then declines.
* The "Multiple-Choice" method experiences a rapid decrease in the proportion of flips after the first iteration.
* "Correct Flip" and "Incorrect Flip" remain relatively stable throughout the five iterations.
* The "Generation" method consistently has a higher proportion of flips than the "Multiple-Choice" method after iteration 1.
### Interpretation
The chart suggests that the Llama-3.1-8B model undergoes a period of initial improvement (as measured by the proportion of flips) when using the "Generation" method, but this improvement plateaus and then declines. The "Multiple-Choice" method shows a rapid decrease in effectiveness, potentially indicating that it reaches a limit quickly. The stability of "Correct Flip" and "Incorrect Flip" suggests that the model's ability to identify and correct errors remains relatively constant throughout the iterations.
The data could indicate that the "Generation" method is more effective for initial model refinement, but further iterations may require alternative strategies. The decline in "Generation" performance could be due to diminishing returns or the need for more complex adjustments. The consistent levels of "Correct Flip" and "Incorrect Flip" suggest that the model's fundamental error-correction mechanisms are not significantly altered by the iterative process. The chart provides insights into the effectiveness of different methods for improving the Llama-3.1-8B model and highlights the potential need for a diversified approach to model optimization.