## Line Chart: Llama-3.1-8B
### Overview
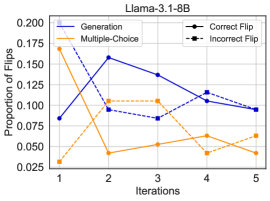
The image displays a line chart titled "Llama-3.1-8B," plotting the "Proportion of Flips" across five sequential "Iterations." The chart compares four distinct data series, differentiated by color (blue vs. orange) and line style (solid vs. dashed). The overall visual suggests a comparative analysis of model behavior or performance metrics over iterative steps.
### Components/Axes
* **Chart Title:** "Llama-3.1-8B" (centered at the top).
* **Y-Axis:**
* **Label:** "Proportion of Flips" (rotated vertically on the left).
* **Scale:** Linear scale ranging from 0.025 to 0.200, with major tick marks at 0.025, 0.050, 0.075, 0.100, 0.125, 0.150, 0.175, and 0.200.
* **X-Axis:**
* **Label:** "Iterations" (centered at the bottom).
* **Scale:** Discrete integer values from 1 to 5.
* **Legend:** Positioned in the top-right corner of the plot area. It defines four series:
1. **Generation:** Blue solid line with circular markers.
2. **Multiple-Choice:** Orange solid line with circular markers.
3. **Correct Flip:** Blue dashed line with circular markers.
4. **Incorrect Flip:** Orange dashed line with circular markers.
### Detailed Analysis
Data points are approximate values read from the chart's grid.
**1. Generation (Blue Solid Line):**
* **Trend:** Rises sharply to a peak at Iteration 2, then declines steadily.
* **Data Points:**
* Iteration 1: ~0.080
* Iteration 2: ~0.160 (Peak)
* Iteration 3: ~0.140
* Iteration 4: ~0.105
* Iteration 5: ~0.090
**2. Multiple-Choice (Orange Solid Line):**
* **Trend:** Starts very high, drops dramatically at Iteration 2, then shows a gradual, slight recovery.
* **Data Points:**
* Iteration 1: ~0.175 (Highest point on the chart)
* Iteration 2: ~0.040 (Sharp drop)
* Iteration 3: ~0.050
* Iteration 4: ~0.040
* Iteration 5: ~0.065
**3. Correct Flip (Blue Dashed Line):**
* **Trend:** Increases to a peak at Iteration 4, with a slight dip at Iteration 3.
* **Data Points:**
* Iteration 1: ~0.030
* Iteration 2: ~0.095
* Iteration 3: ~0.080
* Iteration 4: ~0.115 (Peak)
* Iteration 5: ~0.090
**4. Incorrect Flip (Orange Dashed Line):**
* **Trend:** Fluctuates, with a notable peak at Iteration 2 and a dip at Iteration 4.
* **Data Points:**
* Iteration 1: ~0.030
* Iteration 2: ~0.105 (Peak)
* Iteration 3: ~0.100
* Iteration 4: ~0.040 (Dip)
* Iteration 5: ~0.065
### Key Observations
1. **Inverse Initial Behavior:** At Iteration 1, the "Multiple-Choice" proportion is the highest (~0.175), while "Correct Flip" and "Incorrect Flip" are tied for the lowest (~0.030).
2. **Dramatic Shift at Iteration 2:** This iteration shows the most significant changes. "Multiple-Choice" plummets, "Generation" peaks, and both "Flip" metrics see substantial increases.
3. **Convergence at Iteration 5:** By the final iteration, the values for all four series converge within a narrower band between approximately 0.065 and 0.090.
4. **Line Style Correlation:** The dashed lines ("Correct Flip" and "Incorrect Flip") generally exhibit more volatility (sharper peaks and dips) compared to the solid lines ("Generation" and "Multiple-Choice") after the initial iteration.
### Interpretation
This chart likely visualizes the behavior of the Llama-3.1-8B language model across iterative refinement or testing steps. The "Proportion of Flips" metric suggests a measure of change or correction in model outputs.
* **Method Comparison:** The starkly different trajectories of "Generation" (blue solid) and "Multiple-Choice" (orange solid) imply these are two distinct prompting or evaluation methods. The "Multiple-Choice" method starts with a very high flip rate that quickly stabilizes, while the "Generation" method's flip rate peaks later and declines more gradually.
* **Flip Analysis:** The separation of flips into "Correct" and "Incorrect" provides insight into the quality of the model's changes. The fact that "Correct Flip" peaks at Iteration 4, while "Incorrect Flip" peaks earlier at Iteration 2, could indicate that the model's ability to make beneficial corrections improves with more iterations, while erroneous changes are more prominent earlier in the process.
* **Convergence:** The convergence of all metrics by Iteration 5 suggests the model's behavior stabilizes, with the proportion of flips (both correct and incorrect) settling into a similar range regardless of the initial method (Generation vs. Multiple-Choice). This could point to a point of diminishing returns or a stable state in the iterative process.
* **Underlying Process:** The data tells a story of initial disparity and high volatility that gradually resolves into a more uniform, stable state. This pattern is common in optimization, training, or iterative refinement processes where early steps cause large adjustments that taper off over time.