## Line Graph: Proportion of Flips in Llama-3.1-8B Across Iterations
### Overview
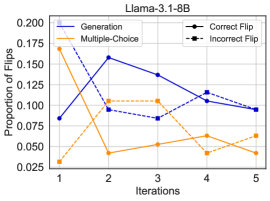
The graph compares the proportion of "flips" (changes in model responses) across five iterations for two methods: "Generation" (blue solid line) and "Multiple-Choice" (orange dashed line). It also includes two marker-based series: "Correct Flip" (black solid circles) and "Incorrect Flip" (black dashed squares). The y-axis represents the proportion of flips (0.025–0.200), while the x-axis shows iterations (1–5).
### Components/Axes
- **X-axis (Iterations)**: Labeled "Iterations" with discrete values 1–5.
- **Y-axis (Proportion of Flips)**: Labeled "Proportion of Flips" with a scale from 0.025 to 0.200.
- **Legend**: Located in the top-right corner, with four entries:
- **Generation**: Blue solid line.
- **Multiple-Choice**: Orange dashed line.
- **Correct Flip**: Black solid circles.
- **Incorrect Flip**: Black dashed squares.
### Detailed Analysis
1. **Generation (Blue Solid Line)**:
- Iteration 1: ~0.18
- Iteration 2: ~0.12
- Iteration 3: ~0.16
- Iteration 4: ~0.11
- Iteration 5: ~0.10
- **Trend**: Peaks at iteration 2, then declines with minor fluctuations.
2. **Multiple-Choice (Orange Dashed Line)**:
- Iteration 1: ~0.17
- Iteration 2: ~0.04
- Iteration 3: ~0.05
- Iteration 4: ~0.06
- Iteration 5: ~0.04
- **Trend**: Sharp drop at iteration 2, followed by gradual increases and stabilization.
3. **Correct Flip (Black Solid Circles)**:
- Iteration 1: ~0.19
- Iteration 2: ~0.13
- Iteration 3: ~0.15
- Iteration 4: ~0.12
- Iteration 5: ~0.10
- **Trend**: Steady decline across iterations.
4. **Incorrect Flip (Black Dashed Squares)**:
- Iteration 1: ~0.01
- Iteration 2: ~0.07
- Iteration 3: ~0.05
- Iteration 4: ~0.08
- Iteration 5: ~0.06
- **Trend**: Initial increase at iteration 2, followed by fluctuations.
### Key Observations
- The **Generation** method shows the highest initial flip proportion (~0.18) but decreases over time.
- **Multiple-Choice** starts high (~0.17) but plummets at iteration 2, suggesting a significant shift in behavior.
- **Correct Flip** consistently declines, indicating fewer accurate response changes over iterations.
- **Incorrect Flip** rises sharply at iteration 2, then stabilizes, implying increased erroneous flips after early iterations.
### Interpretation
The data suggests that the **Generation** method exhibits volatile flip behavior, with a notable drop after iteration 2. The **Multiple-Choice** method’s drastic decline at iteration 2 may indicate a shift in response strategy or model adaptation. The **Correct Flip** trend implies reduced accuracy in response changes over time, while the **Incorrect Flip** increase hints at growing errors in later iterations. This could reflect model instability or learning dynamics during iterative processes. The divergence between methods highlights trade-offs between response consistency and adaptability.