## Line Chart: Accuracy vs. Completion Tokens
### Overview
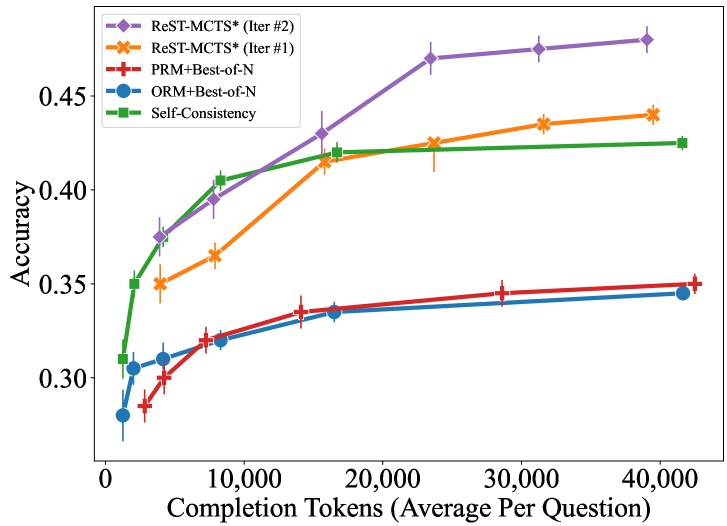
The image is a line chart comparing the accuracy of different methods against the number of completion tokens used. The x-axis represents "Completion Tokens (Average Per Question)", ranging from 0 to 40,000. The y-axis represents "Accuracy", ranging from 0.30 to 0.45. Five different methods are compared: ReST-MCTS* (Iter #2), ReST-MCTS* (Iter #1), PRM+Best-of-N, ORM+Best-of-N, and Self-Consistency. Error bars are present on each data point.
### Components/Axes
* **X-axis:** Completion Tokens (Average Per Question)
* Scale: 0 to 40,000
* Markers: 0, 10,000, 20,000, 30,000, 40,000
* **Y-axis:** Accuracy
* Scale: 0.30 to 0.45
* Markers: 0.30, 0.35, 0.40, 0.45
* **Legend:** Located in the top-left corner.
* ReST-MCTS* (Iter #2): Purple line with diamond markers
* ReST-MCTS* (Iter #1): Orange line with cross markers
* PRM+Best-of-N: Red line with plus markers
* ORM+Best-of-N: Blue line with circle markers
* Self-Consistency: Green line with square markers
### Detailed Analysis
* **ReST-MCTS* (Iter #2):** (Purple, Diamond)
* Trend: Slopes upward, showing increasing accuracy with more tokens.
* Data Points:
* (1000, 0.37) +/- 0.01
* (7500, 0.38) +/- 0.01
* (17500, 0.42) +/- 0.01
* (27500, 0.47) +/- 0.01
* (42500, 0.48) +/- 0.01
* **ReST-MCTS* (Iter #1):** (Orange, Cross)
* Trend: Slopes upward initially, then plateaus.
* Data Points:
* (1000, 0.35) +/- 0.01
* (7500, 0.36) +/- 0.01
* (17500, 0.42) +/- 0.01
* (27500, 0.43) +/- 0.01
* (42500, 0.44) +/- 0.01
* **PRM+Best-of-N:** (Red, Plus)
* Trend: Slopes upward, but at a slower rate than the other methods.
* Data Points:
* (1000, 0.29) +/- 0.01
* (7500, 0.32) +/- 0.01
* (17500, 0.33) +/- 0.01
* (27500, 0.34) +/- 0.01
* (42500, 0.35) +/- 0.01
* **ORM+Best-of-N:** (Blue, Circle)
* Trend: Similar to PRM+Best-of-N, slopes upward slowly.
* Data Points:
* (1000, 0.28) +/- 0.01
* (7500, 0.31) +/- 0.01
* (17500, 0.33) +/- 0.01
* (27500, 0.34) +/- 0.01
* (42500, 0.345) +/- 0.01
* **Self-Consistency:** (Green, Square)
* Trend: Slopes upward initially, then plateaus.
* Data Points:
* (1000, 0.35) +/- 0.01
* (7500, 0.40) +/- 0.01
* (17500, 0.42) +/- 0.01
* (27500, 0.425) +/- 0.01
* (42500, 0.425) +/- 0.01
### Key Observations
* ReST-MCTS* (Iter #2) consistently achieves the highest accuracy across all token counts.
* PRM+Best-of-N and ORM+Best-of-N have the lowest accuracy and show the least improvement with increasing tokens.
* Self-Consistency and ReST-MCTS* (Iter #1) show similar performance, with a rapid increase in accuracy initially, followed by a plateau.
* The error bars suggest some variability in the accuracy measurements.
### Interpretation
The chart demonstrates the relationship between the number of completion tokens used and the accuracy of different methods. ReST-MCTS* (Iter #2) appears to be the most effective method, achieving the highest accuracy with increasing tokens. The other methods show varying degrees of improvement, with PRM+Best-of-N and ORM+Best-of-N being the least effective. The plateauing of Self-Consistency and ReST-MCTS* (Iter #1) suggests that there may be a limit to the improvement achievable with these methods by simply increasing the number of tokens. The error bars indicate that the accuracy measurements are not perfectly consistent, and there is some degree of variability in the results.