## Line Chart: Accuracy vs. Completion Tokens for Various Reasoning Methods
### Overview
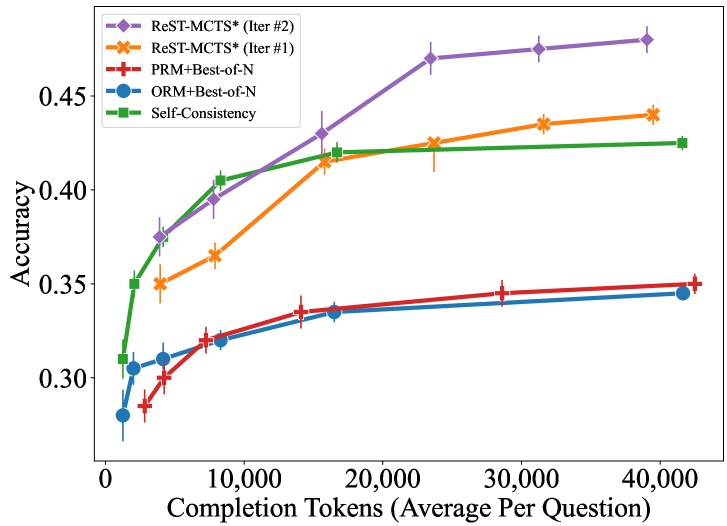
This chart illustrates the relationship between computational cost (measured in "Completion Tokens (Average Per Question)") and model performance ("Accuracy") across five distinct reasoning or decoding strategies. The data shows that for all methods, increasing the number of completion tokens generally leads to higher accuracy, though the rate of improvement and the performance ceiling vary significantly between methods.
### Components/Axes
* **Y-Axis:** Labeled "Accuracy". The scale ranges from below 0.30 to 0.45, with major grid lines at 0.30, 0.35, 0.40, and 0.45.
* **X-Axis:** Labeled "Completion Tokens (Average Per Question)". The scale ranges from 0 to 40,000, with major grid lines at 10,000, 20,000, 30,000, and 40,000.
* **Legend:** Positioned in the top-left corner of the chart area.
* **Purple Diamond:** ReST-MCTS* (Iter #2)
* **Orange X:** ReST-MCTS* (Iter #1)
* **Red Plus:** PRM+Best-of-N
* **Blue Circle:** ORM+Best-of-N
* **Green Square:** Self-Consistency
### Detailed Analysis
The chart displays five data series, each with error bars indicating variance.
1. **ReST-MCTS* (Iter #2) [Purple Diamond]:**
* **Trend:** This line exhibits the steepest and most consistent upward slope. It starts at approximately (4,000 tokens, 0.37 accuracy) and climbs steadily to reach the highest point on the chart at approximately (40,000 tokens, 0.48 accuracy).
2. **ReST-MCTS* (Iter #1) [Orange X]:**
* **Trend:** This line shows a strong upward trend, though it is consistently below the Iter #2 version. It starts near (4,000 tokens, 0.35 accuracy) and rises to approximately (40,000 tokens, 0.44 accuracy).
3. **Self-Consistency [Green Square]:**
* **Trend:** This method shows a very sharp, rapid increase in accuracy at low token counts (from ~1,500 tokens to ~4,000 tokens). After ~4,000 tokens, the curve flattens significantly, showing diminishing returns, and plateaus at approximately 0.425 accuracy by the 40,000-token mark.
4. **PRM+Best-of-N [Red Plus]:**
* **Trend:** This line shows a steady, moderate upward slope. It begins near (3,000 tokens, 0.28 accuracy) and ends near (42,000 tokens, 0.35 accuracy).
5. **ORM+Best-of-N [Blue Circle]:**
* **Trend:** This line is very similar to the PRM+Best-of-N line, often overlapping or running parallel just below it. It starts near (1,500 tokens, 0.28 accuracy) and ends near (42,000 tokens, 0.345 accuracy).
### Key Observations
* **Performance Leader:** ReST-MCTS* (Iter #2) is the most effective method, achieving the highest accuracy across the entire token range.
* **Diminishing Returns:** The "Self-Consistency" method is highly efficient for low-compute scenarios but fails to scale as effectively as the MCTS-based methods when more tokens are allocated.
* **Clustering:** The "Best-of-N" methods (PRM and ORM) cluster together at the bottom of the chart, suggesting they are less effective at utilizing higher token counts compared to the MCTS-based approaches.
* **Scaling:** The MCTS-based methods (ReST-MCTS*) demonstrate superior scaling properties, as their accuracy continues to climb significantly even at higher token counts, whereas other methods begin to plateau.
### Interpretation
This data demonstrates that the *method* of inference-time computation is as critical as the *amount* of computation.
* **Efficiency vs. Ceiling:** "Self-Consistency" is an excellent choice if the computational budget is strictly limited (low token count), as it reaches a respectable accuracy very quickly. However, if the goal is to maximize accuracy and computational budget is available, it is a poor choice due to its early plateau.
* **Algorithmic Superiority:** The ReST-MCTS* (Iter #2) method suggests that iterative refinement (implied by "Iter #2") combined with Monte Carlo Tree Search is a superior strategy for leveraging increased inference-time compute. It does not hit the same plateau as the other methods, indicating it effectively utilizes the additional tokens to explore the reasoning space more productively.
* **PRM vs. ORM:** The marginal difference between PRM (Process Reward Model) and ORM (Outcome Reward Model) in the "Best-of-N" setting suggests that, in this specific experimental setup, the reward model type had a negligible impact on the final accuracy compared to the choice of the decoding strategy itself.