\n
## Line Chart: Accuracy vs. Completion Tokens for Different Methods
### Overview
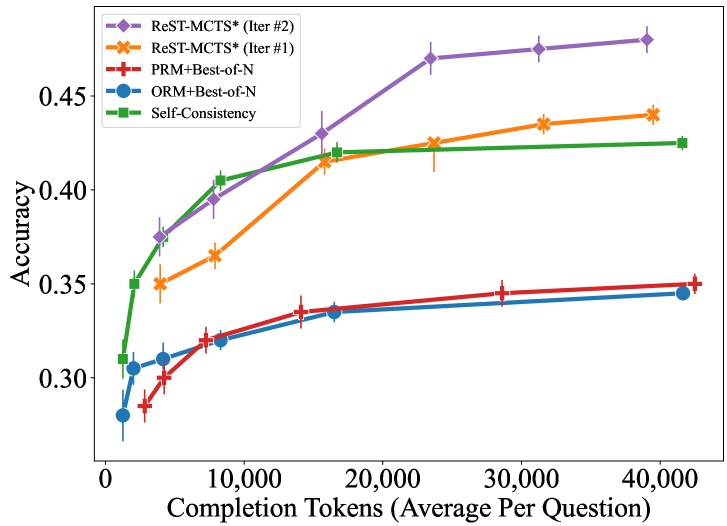
This line chart displays the relationship between accuracy and completion tokens (average per question) for five different methods: ReST-MCTS* (Iter #2), ReST-MCTS* (Iter #1), PRM+Best-of-N, ORM+Best-of-N, and Self-Consistency. The chart shows how accuracy changes as the number of completion tokens increases. Error bars are present for each data series, indicating the variability in accuracy.
### Components/Axes
* **X-axis:** Completion Tokens (Average Per Question), ranging from 0 to 40,000.
* **Y-axis:** Accuracy, ranging from 0.30 to 0.48.
* **Data Series:**
* ReST-MCTS* (Iter #2) - Purple line with diamond markers.
* ReST-MCTS* (Iter #1) - Orange line with asterisk markers.
* PRM+Best-of-N - Red line with plus markers.
* ORM+Best-of-N - Blue line with circle markers.
* Self-Consistency - Green line with square markers.
* **Legend:** Located in the top-left corner of the chart, clearly labeling each data series with its corresponding color and marker.
### Detailed Analysis
Here's a breakdown of each data series, including approximate values and observed trends:
* **ReST-MCTS* (Iter #2) (Purple):** The line slopes upward sharply initially, then plateaus.
* At 0 tokens: ~0.32 accuracy.
* At 10,000 tokens: ~0.42 accuracy.
* At 20,000 tokens: ~0.45 accuracy.
* At 40,000 tokens: ~0.47 accuracy.
* **ReST-MCTS* (Iter #1) (Orange):** Similar to Iter #2, but starts lower and plateaus slightly below.
* At 0 tokens: ~0.28 accuracy.
* At 10,000 tokens: ~0.38 accuracy.
* At 20,000 tokens: ~0.43 accuracy.
* At 40,000 tokens: ~0.44 accuracy.
* **PRM+Best-of-N (Red):** A relatively flat line, showing minimal improvement with increasing tokens.
* At 0 tokens: ~0.30 accuracy.
* At 10,000 tokens: ~0.34 accuracy.
* At 20,000 tokens: ~0.35 accuracy.
* At 40,000 tokens: ~0.34 accuracy.
* **ORM+Best-of-N (Blue):** Shows a moderate increase in accuracy with increasing tokens, but less than ReST-MCTS*.
* At 0 tokens: ~0.26 accuracy.
* At 10,000 tokens: ~0.36 accuracy.
* At 20,000 tokens: ~0.40 accuracy.
* At 40,000 tokens: ~0.41 accuracy.
* **Self-Consistency (Green):** Increases steadily, but plateaus before ReST-MCTS*.
* At 0 tokens: ~0.31 accuracy.
* At 10,000 tokens: ~0.40 accuracy.
* At 20,000 tokens: ~0.42 accuracy.
* At 40,000 tokens: ~0.42 accuracy.
Error bars are present for each data point, with approximate lengths of +/- 0.02 to 0.04.
### Key Observations
* ReST-MCTS* (Iter #2) consistently achieves the highest accuracy across all completion token values.
* PRM+Best-of-N exhibits the lowest accuracy and the least improvement with increasing tokens.
* All methods show diminishing returns in accuracy as the number of completion tokens increases beyond 20,000.
* The error bars suggest that the accuracy measurements have some variability, but the overall trends are clear.
### Interpretation
The data suggests that increasing the number of completion tokens generally improves accuracy, but the benefit diminishes after a certain point. ReST-MCTS* (Iter #2) appears to be the most effective method for achieving high accuracy, particularly when a sufficient number of completion tokens are used. The relatively poor performance of PRM+Best-of-N indicates that this method may not be well-suited for this task or requires further optimization. The plateauing of all curves suggests that there are inherent limitations to the methods, or that other factors (e.g., model capacity, data quality) become more important at higher token counts. The error bars indicate that the observed differences in accuracy between methods may not always be statistically significant, but the consistent ranking of ReST-MCTS* (Iter #2) suggests that it is a robust performer. This data could be used to inform decisions about resource allocation (e.g., how many completion tokens to use) and method selection for tasks requiring high accuracy.