\n
## Line Chart: Accuracy vs. Completion Tokens for Various Methods
### Overview
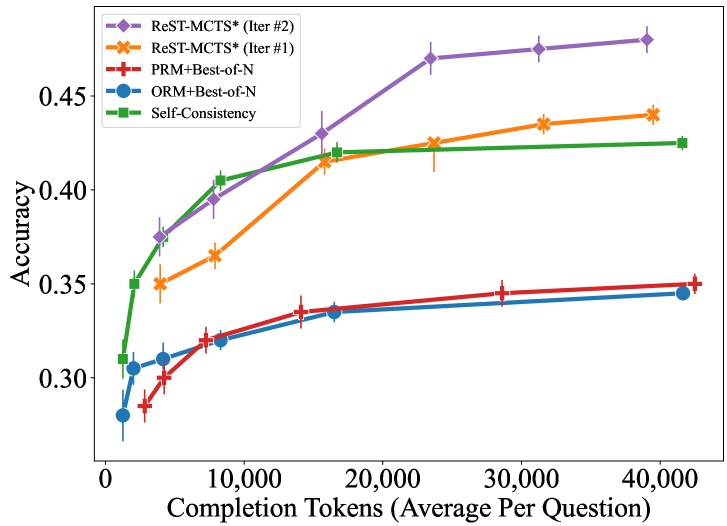
The image is a line chart plotting the accuracy of five different computational methods against the average number of completion tokens used per question. The chart demonstrates how performance (accuracy) scales with increased computational effort (tokens). The data suggests a general trend where more tokens lead to higher accuracy, but with varying efficiency and ceilings across methods.
### Components/Axes
* **Chart Type:** Line chart with error bars.
* **X-Axis:** Labeled **"Completion Tokens (Average Per Question)"**. The scale is linear, with major tick marks at 0, 10,000, 20,000, 30,000, and 40,000.
* **Y-Axis:** Labeled **"Accuracy"**. The scale is linear, ranging from approximately 0.28 to 0.48, with major tick marks at 0.30, 0.35, 0.40, and 0.45.
* **Legend:** Located in the top-left corner of the plot area. It defines five data series:
1. **ReST-MCTS* (Iter #2):** Purple line with diamond markers.
2. **ReST-MCTS* (Iter #1):** Orange line with 'X' markers.
3. **PRM+Best-of-N:** Red line with plus ('+') markers.
4. **ORM+Best-of-N:** Blue line with circle markers.
5. **Self-Consistency:** Green line with square markers.
### Detailed Analysis
**Trend Verification & Data Points (Approximate):**
1. **ReST-MCTS* (Iter #2) - Purple Diamond:**
* **Trend:** Steep, consistent upward slope, showing the highest accuracy gain per token. It is the top-performing method across the entire range.
* **Data Points:** Starts at ~0.31 accuracy (~1,000 tokens). Rises sharply to ~0.375 (~5,000 tokens), ~0.40 (~8,000 tokens), ~0.43 (~15,000 tokens), ~0.47 (~24,000 tokens), and plateaus slightly to end at ~0.48 (~40,000 tokens).
2. **ReST-MCTS* (Iter #1) - Orange 'X':**
* **Trend:** Strong upward slope, initially below Self-Consistency but surpasses it after ~15,000 tokens. It is the second-best performer.
* **Data Points:** Starts at ~0.35 (~5,000 tokens). Increases to ~0.365 (~8,000 tokens), ~0.415 (~15,000 tokens), ~0.425 (~24,000 tokens), ~0.435 (~31,000 tokens), and ends at ~0.44 (~40,000 tokens).
3. **Self-Consistency - Green Square:**
* **Trend:** Very steep initial rise, then a pronounced plateau. It is the most token-efficient method at low token counts (<10,000) but is overtaken by the ReST-MCTS* methods.
* **Data Points:** Starts at ~0.31 (~1,000 tokens). Jumps to ~0.35 (~2,500 tokens), ~0.405 (~8,000 tokens), and then flattens, reaching ~0.42 (~15,000 tokens) and ending at ~0.425 (~40,000 tokens).
4. **PRM+Best-of-N - Red '+':**
* **Trend:** Gradual, steady upward slope. Performance is significantly lower than the top three methods.
* **Data Points:** Starts at ~0.285 (~2,500 tokens). Rises slowly to ~0.30 (~5,000 tokens), ~0.32 (~8,000 tokens), ~0.335 (~15,000 tokens), ~0.345 (~29,000 tokens), and ends at ~0.35 (~42,000 tokens).
5. **ORM+Best-of-N - Blue Circle:**
* **Trend:** Very similar gradual upward slope to PRM+Best-of-N, consistently performing slightly worse.
* **Data Points:** Starts at ~0.28 (~1,000 tokens). Increases to ~0.305 (~2,500 tokens), ~0.31 (~5,000 tokens), ~0.32 (~8,000 tokens), ~0.335 (~16,000 tokens), and ends at ~0.345 (~41,000 tokens).
### Key Observations
* **Performance Hierarchy:** A clear stratification exists: ReST-MCTS* (Iter #2) > ReST-MCTS* (Iter #1) > Self-Consistency > PRM+Best-of-N ≈ ORM+Best-of-N.
* **Diminishing Returns:** All methods show diminishing returns; the accuracy gain per additional token decreases as the total token count increases. This is most extreme for Self-Consistency.
* **Iterative Improvement:** The second iteration of ReST-MCTS* (Iter #2) shows a substantial and consistent accuracy improvement over the first iteration (Iter #1) at all comparable token budgets.
* **Low-Token Efficiency:** Self-Consistency is the most efficient method for very low token budgets (<10,000), achieving high accuracy quickly before plateauing.
* **Error Bars:** All data points include vertical error bars, indicating variance or confidence intervals in the accuracy measurements. The bars appear relatively consistent in size across methods.
### Interpretation
The chart provides a comparative analysis of the efficiency and effectiveness of different reasoning or generation methods, likely in the context of large language models or similar AI systems. The key insight is that **iterative refinement (ReST-MCTS*) yields superior scaling laws**—it translates additional computational resources (tokens) into accuracy gains more effectively than the other methods shown.
The data suggests a trade-off: methods like Self-Consistency offer a "quick win" with high initial accuracy at low cost, but hit a performance ceiling. In contrast, the ReST-MCTS* approach, especially with multiple iterations, demonstrates a higher performance ceiling and better long-term scaling, making it more suitable for applications where maximizing accuracy is paramount and higher token budgets are acceptable. The significant gap between the top two methods and the Best-of-N baselines highlights the advantage of more sophisticated search or verification strategies over simple sampling and ranking.