## Line Graph: Accuracy vs. Completion Tokens (Average Per Question)
### Overview
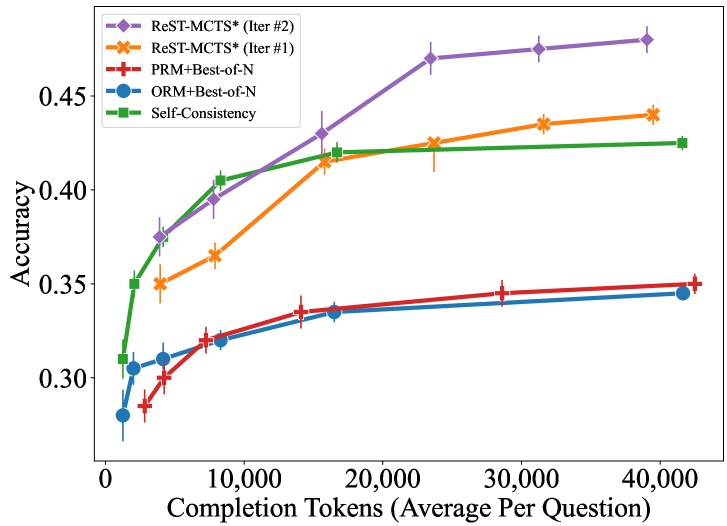
The image is a line graph comparing the accuracy of five different methods across varying numbers of completion tokens (average per question). The x-axis represents the number of completion tokens (ranging from 0 to 40,000), and the y-axis represents accuracy (ranging from 0.30 to 0.45). Five distinct lines, each with unique colors and markers, represent different methods. Error bars are present for all data points, indicating variability.
### Components/Axes
- **X-axis**: "Completion Tokens (Average Per Question)" (0 to 40,000, in increments of 10,000).
- **Y-axis**: "Accuracy" (0.30 to 0.45, in increments of 0.05).
- **Legend**: Located in the top-left corner, with the following entries:
- **ReST-MCTS* (Iter #2)**: Purple diamonds.
- **ReST-MCTS* (Iter #1)**: Orange crosses.
- **PRM+Best-of-N**: Red plus signs.
- **ORM+Best-of-N**: Blue circles.
- **Self-Consistency**: Green squares.
### Detailed Analysis
1. **ReST-MCTS* (Iter #2)** (Purple diamonds):
- Starts at ~0.37 accuracy at 5,000 tokens.
- Increases steadily to ~0.45 accuracy at 40,000 tokens.
- Error bars show moderate variability (~±0.01–0.02).
2. **ReST-MCTS* (Iter #1)** (Orange crosses):
- Begins at ~0.35 accuracy at 5,000 tokens.
- Rises to ~0.43 accuracy at 40,000 tokens.
- Error bars are slightly larger than Iter #2 (~±0.02–0.03).
3. **PRM+Best-of-N** (Red plus signs):
- Starts at ~0.30 accuracy at 5,000 tokens.
- Gradually increases to ~0.35 accuracy at 40,000 tokens.
- Error bars are smaller (~±0.01–0.02).
4. **ORM+Best-of-N** (Blue circles):
- Begins at ~0.30 accuracy at 5,000 tokens.
- Slightly increases to ~0.34 accuracy at 40,000 tokens.
- Error bars are similar to PRM+Best-of-N (~±0.01–0.02).
5. **Self-Consistency** (Green squares):
- Starts at ~0.35 accuracy at 5,000 tokens.
- Rises to ~0.42 accuracy at 40,000 tokens.
- Error bars are moderate (~±0.01–0.02).
### Key Observations
- **ReST-MCTS* (Iter #2)** consistently outperforms all other methods, with the highest accuracy across all token ranges.
- The gap between **ReST-MCTS* (Iter #2)** and **ReST-MCTS* (Iter #1)** widens as token count increases, suggesting Iter #2 is more effective.
- **Self-Consistency** is the second-best method, outperforming PRM+Best-of-N and ORM+Best-of-N.
- **PRM+Best-of-N** and **ORM+Best-of-N** show similar performance, with minimal differences in accuracy.
- All methods exhibit diminishing returns as token count increases, with accuracy plateaus observed at higher token ranges.
### Interpretation
The data suggests that **ReST-MCTS* (Iter #2)** is the most effective method for improving accuracy with increasing completion tokens, likely due to its iterative refinement process. **Self-Consistency** serves as a strong alternative, while **PRM+Best-of-N** and **ORM+Best-of-N** are less effective but comparable to each other. The error bars indicate that variability in accuracy is relatively low for all methods, though **ReST-MCTS* (Iter #1)** shows slightly higher uncertainty. The trends imply that token quantity has a diminishing impact on accuracy beyond a certain threshold, highlighting the importance of method selection over token count in this context.