## Line Chart: Importance Score Distribution Across Reasoning Steps
### Overview
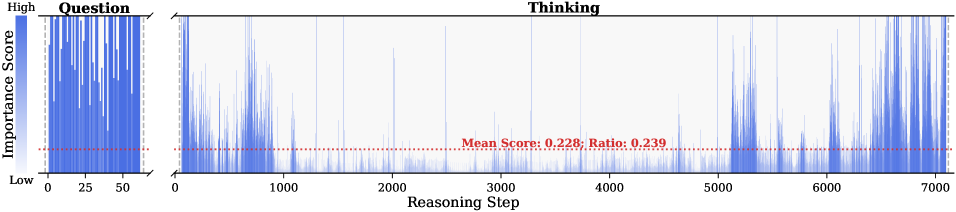
The image displays a line chart divided into two distinct sections: a "Question" segment on the left and a "Thinking" segment on the right. The chart visualizes the distribution of "Importance Scores" across sequential "Reasoning Steps," with a red dashed line indicating a calculated mean score and ratio. The y-axis uses a gradient from light blue (low) to dark blue (high) to represent importance scores, while the x-axis spans from 0 to 7000 reasoning steps.
---
### Components/Axes
- **X-Axis (Reasoning Step)**:
- Labeled "Reasoning Step" with numerical markers at 0, 25, 50, 1000, 2000, 3000, 4000, 5000, 6000, and 7000.
- The "Question" segment spans 0–50 steps, while the "Thinking" segment spans 0–7000 steps.
- **Y-Axis (Importance Score)**:
- Labeled "Importance Score" with a gradient from light blue (low) to dark blue (high).
- A horizontal red dashed line labeled "Mean Score: 0.228; Ratio: 0.239" spans the entire chart.
- **Legend**:
- Located on the left, with a single entry: "Importance Score" (blue gradient).
- The red dashed line is explicitly labeled as the mean score and ratio.
---
### Detailed Analysis
#### "Question" Segment (0–50 Steps)
- **Structure**: A vertical bar chart with 50 bars, each representing a reasoning step.
- **Trend**:
- Bars vary in height, with some reaching near the top of the y-axis (high importance) and others near the bottom (low importance).
- No consistent pattern; distribution appears irregular.
- **Key Data Points**:
- Highest bars (dark blue) occur at steps ~10, 20, 30, and 40.
- Lowest bars (light blue) occur at steps ~5, 15, 25, and 45.
#### "Thinking" Segment (0–7000 Steps)
- **Structure**: A line chart with blue vertical lines (spikes) over a white background.
- **Trend**:
- Spikes are irregular, with some reaching the top of the y-axis (high importance) and others near the bottom (low importance).
- The red dashed line (mean score) remains consistently at ~0.228 across all steps.
- **Key Data Points**:
- Notable spikes occur at steps ~1000, 3000, 5000, and 7000.
- The mean score (0.228) is significantly lower than the peak values of individual spikes.
---
### Key Observations
1. **Divergent Distributions**:
- The "Question" segment shows a more concentrated distribution of importance scores, while the "Thinking" segment exhibits sporadic, high-intensity spikes.
2. **Mean Score Context**:
- The red dashed line (mean score: 0.228) is much lower than the peak values in both segments, suggesting most reasoning steps have low importance.
3. **Ratio Interpretation**:
- The ratio (0.239) is slightly higher than the mean score, possibly indicating a proportional relationship between the mean and another metric (e.g., total importance or step count).
---
### Interpretation
- **Data Implications**:
- The chart likely represents the importance of reasoning steps in a decision-making or problem-solving process. The "Question" segment may reflect initial, structured steps, while the "Thinking" segment captures exploratory or iterative reasoning.
- The low mean score (0.228) suggests that most steps are not critical, but the presence of spikes indicates moments of high cognitive demand or significance.
- **Anomalies**:
- The "Thinking" segment’s spikes at 1000, 3000, 5000, and 7000 steps may correspond to pivotal moments in the reasoning process (e.g., hypothesis testing, conclusion drawing).
- The "Question" segment’s irregular distribution implies variability in the importance of early steps, possibly due to contextual factors or question complexity.
- **Technical Relevance**:
- The chart could be used to optimize reasoning algorithms by identifying and prioritizing high-importance steps. The mean and ratio provide a baseline for evaluating overall efficiency.
---
### Spatial Grounding
- **Legend**: Positioned on the left, aligned with the y-axis.
- **Red Dashed Line**: Horizontally centered across the chart, spanning both segments.
- **Axis Labels**: Clearly labeled at the top (x-axis) and left (y-axis), with numerical markers for reference.
---
### Content Details
- **Textual Elements**:
- "Question" (top-left of the left segment).
- "Thinking" (top-center of the right segment).
- "Mean Score: 0.228; Ratio: 0.239" (red dashed line label).
- **Numerical Values**:
- X-axis: 0, 25, 50, 1000, 2000, 3000, 4000, 5000, 6000, 7000.
- Y-axis: Gradient from light blue (low) to dark blue (high).
---
### Final Notes
The chart provides a visual representation of reasoning step importance, highlighting both structured and exploratory phases. The mean score and ratio offer quantitative insights, while the irregular distributions suggest the need for further analysis to identify patterns or optimize processes.