\n
## Chart: Importance Score vs. Reasoning Step
### Overview
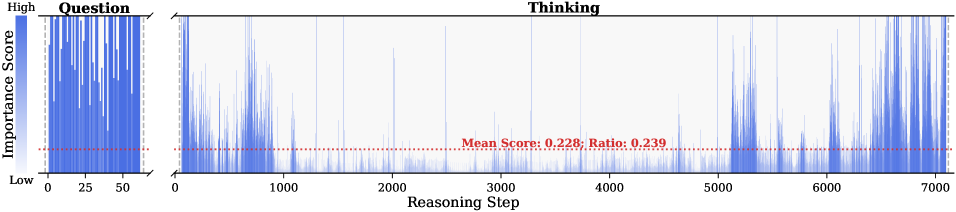
The image presents a chart visualizing the "Importance Score" against "Reasoning Step". The chart appears to represent the fluctuation of importance during a reasoning process, divided into "Question" and "Thinking" phases. A horizontal dotted line indicates the mean importance score and ratio.
### Components/Axes
* **X-axis:** "Reasoning Step", ranging from 0 to approximately 7000.
* **Y-axis:** "Importance Score", ranging from "Low" to "High". The scale is not numerically defined, but visually represents relative importance.
* **Chart Area:** Filled with a fluctuating blue line representing the importance score over reasoning steps.
* **Phase Labels:** Two labels are present above the chart: "Question" (covering steps 0-50) and "Thinking" (covering steps 50-7000).
* **Mean Score Indicator:** A horizontal dotted red line with the text "Mean Score: 0.228, Ratio: 0.239" positioned approximately at the y-value of 0.23.
* **Color Scheme:** Blue for the importance score line, red for the mean score indicator.
### Detailed Analysis
The chart shows a highly variable importance score over the reasoning steps.
* **Question Phase (0-50):** The importance score starts high and rapidly decreases, exhibiting significant fluctuations. The score appears to be generally higher in this phase compared to the initial part of the "Thinking" phase.
* **Thinking Phase (50-7000):** The importance score remains generally low, with frequent, smaller fluctuations. There are occasional spikes in importance, but they are less pronounced and less frequent than in the "Question" phase.
* **Mean Score:** The mean importance score is 0.228, and the ratio is 0.239. This represents the average importance score across all reasoning steps.
* **Data Points (Approximate):**
* At Reasoning Step 0, Importance Score is approximately "High".
* At Reasoning Step 25, Importance Score is approximately 0.6 (estimated visually).
* At Reasoning Step 50, Importance Score is approximately 0.2 (estimated visually).
* At Reasoning Step 1000, Importance Score is approximately 0.15 (estimated visually).
* At Reasoning Step 5000, Importance Score is approximately 0.3 (estimated visually).
* At Reasoning Step 6500, Importance Score is approximately 0.1 (estimated visually).
### Key Observations
* The importance score is significantly higher during the "Question" phase compared to the "Thinking" phase.
* The "Thinking" phase exhibits a generally low and stable importance score, with occasional spikes.
* The fluctuations in importance score suggest a dynamic reasoning process where the relevance of different steps varies considerably.
* The mean importance score is relatively low (0.228), indicating that, on average, most reasoning steps have a low importance score.
### Interpretation
The chart suggests that the initial "Question" phase is characterized by high cognitive activity and fluctuating relevance, while the "Thinking" phase involves a more sustained, but generally lower-intensity, reasoning process. The high variability in the importance score indicates that the reasoning process is not linear or uniform; some steps are more crucial than others. The relatively low mean importance score suggests that a significant portion of the reasoning process involves steps that are not directly contributing to the overall solution. The ratio of 0.239 could represent the proportion of steps exceeding the mean importance. This data could be used to analyze the efficiency of a reasoning process and identify areas for improvement. The chart implies that focusing on the initial question phase and identifying key reasoning steps could lead to more effective problem-solving.