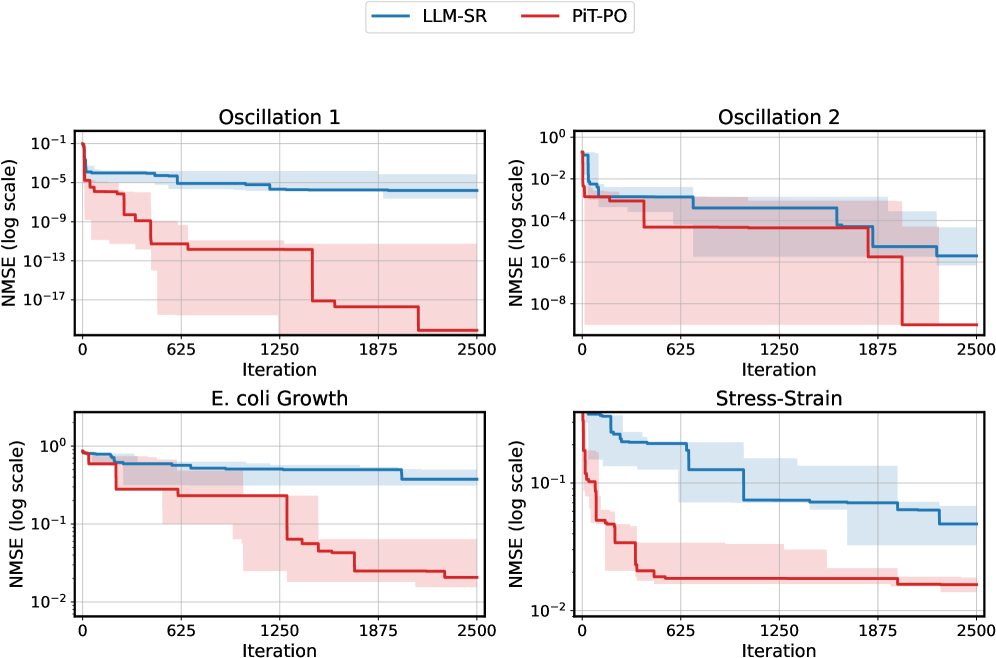
## Line Chart: Comparative NMSE Performance Across Iterations
### Overview
The image contains four line charts arranged in a 2x2 grid, comparing the performance of two methods (LLM-SR and PiT-PO) across four datasets: Oscillation 1, Oscillation 2, E. coli Growth, and Stress-Strain. Each chart tracks the Normalized Mean Squared Error (NMSE) on a logarithmic scale against iteration count (0–2500). Shaded regions represent uncertainty bounds for each method.
### Components/Axes
- **X-axis**: Iteration (0–2500, linear scale)
- **Y-axis**: NMSE (log scale, 10⁻¹⁷ to 10⁰)
- **Legends**:
- Blue line/shade: LLM-SR
- Red line/shade: PiT-PO
- **Chart Titles**:
- Top-left: Oscillation 1
- Top-right: Oscillation 2
- Bottom-left: E. coli Growth
- Bottom-right: Stress-Strain
### Detailed Analysis
#### Oscillation 1
- **LLM-SR (Blue)**:
- Starts at ~10⁻¹ NMSE, drops sharply to ~10⁻⁵ by 625 iterations, then plateaus.
- Uncertainty (shaded blue) narrows significantly after 1250 iterations.
- **PiT-PO (Red)**:
- Begins at ~10⁻³ NMSE, decreases to ~10⁻⁹ by 1250 iterations, then stabilizes.
- Uncertainty (shaded red) remains broader than LLM-SR throughout.
#### Oscillation 2
- **LLM-SR (Blue)**:
- Initial NMSE ~10⁻², declines to ~10⁻⁴ by 625 iterations, then plateaus.
- Uncertainty reduces by ~50% after 1875 iterations.
- **PiT-PO (Red)**:
- Starts at ~10⁻⁴ NMSE, drops to ~10⁻⁶ by 1250 iterations, then stabilizes.
- Shaded red region shows consistent uncertainty reduction.
#### E. coli Growth
- **LLM-SR (Blue)**:
- Begins at ~10⁰ NMSE, decreases to ~10⁻¹ by 625 iterations, then plateaus.
- Uncertainty narrows by ~70% after 1250 iterations.
- **PiT-PO (Red)**:
- Starts at ~10⁻¹ NMSE, drops to ~10⁻² by 1250 iterations, then stabilizes.
- Shaded red region shows gradual uncertainty reduction.
#### Stress-Strain
- **LLM-SR (Blue)**:
- Initial NMSE ~10⁻¹, decreases to ~10⁻² by 625 iterations, then plateaus.
- Uncertainty reduces by ~60% after 1875 iterations.
- **PiT-PO (Red)**:
- Begins at ~10⁻² NMSE, drops to ~10⁻³ by 1250 iterations, then stabilizes.
- Shaded red region shows steady uncertainty reduction.
### Key Observations
1. **Performance Trends**:
- LLM-SR consistently achieves lower NMSE than PiT-PO across all datasets.
- Both methods show rapid improvement in early iterations (0–1250), with diminishing returns afterward.
2. **Uncertainty Patterns**:
- Shaded regions (confidence intervals) narrow for both methods as iterations increase, indicating improved model stability.
- LLM-SR’s uncertainty bounds are consistently tighter than PiT-PO’s.
3. **Dataset-Specific Behavior**:
- Oscillation 1 and Stress-Strain show the most dramatic NMSE reductions.
- E. coli Growth exhibits the slowest convergence for both methods.
### Interpretation
The data demonstrates that **LLM-SR outperforms PiT-PO** in all tested scenarios, achieving lower NMSE and tighter confidence intervals. The logarithmic scale highlights exponential improvements in early iterations, suggesting these methods are particularly effective for initial model calibration. The narrowing uncertainty bands imply that both approaches become more reliable with increased computational effort, but LLM-SR maintains a consistent advantage. This could indicate architectural or algorithmic efficiencies in LLM-SR that make it preferable for applications requiring high-precision predictions under iterative refinement.