## Line Chart: Win Rate vs. Instruction Complexity
### Overview
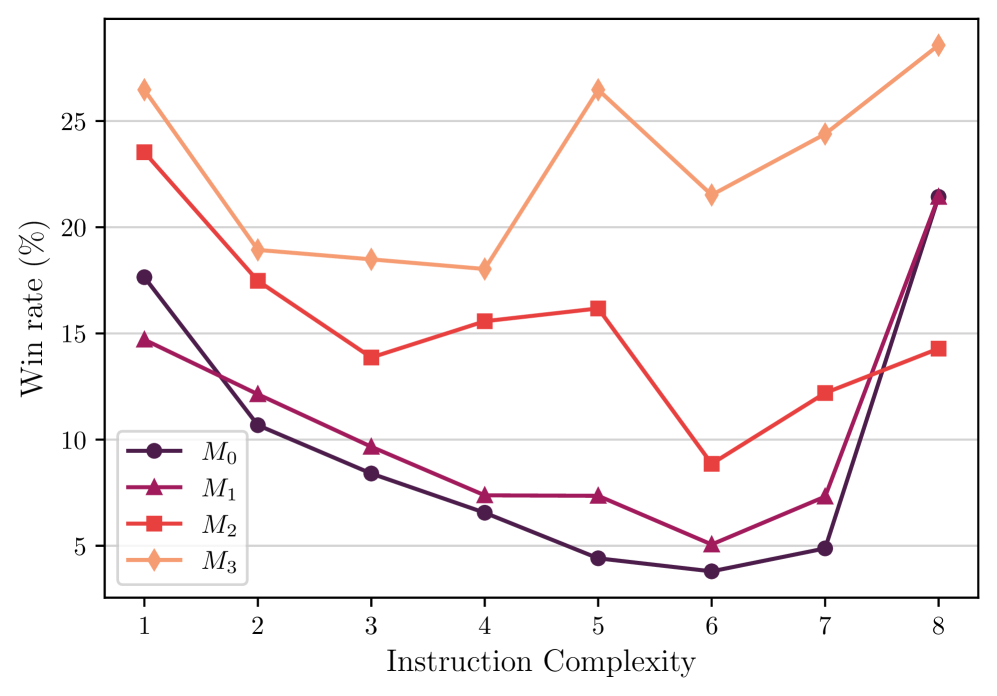
The image is a line chart that plots the win rate (in percentage) against instruction complexity. There are four data series, labeled M0, M1, M2, and M3, each represented by a line with distinct markers. The chart aims to show how the win rate changes with increasing instruction complexity for each of the four series.
### Components/Axes
* **X-axis:** Instruction Complexity, with integer values from 1 to 8.
* **Y-axis:** Win rate (%), with values ranging from 5% to 25%. Horizontal gridlines are present at approximately 5% intervals.
* **Legend:** Located in the bottom-left corner, it identifies the four data series:
* M0 (dark purple line with circle markers)
* M1 (purple line with triangle markers)
* M2 (red line with square markers)
* M3 (orange line with diamond markers)
### Detailed Analysis
* **M0 (dark purple, circles):** The win rate generally decreases from instruction complexity 1 to 6, then sharply increases at instruction complexity 8.
* Complexity 1: Approximately 17.5%
* Complexity 2: Approximately 12%
* Complexity 3: Approximately 9%
* Complexity 4: Approximately 7%
* Complexity 5: Approximately 4.2%
* Complexity 6: Approximately 3.7%
* Complexity 7: Approximately 4.8%
* Complexity 8: Approximately 21.5%
* **M1 (purple, triangles):** The win rate decreases from instruction complexity 1 to 6, then increases at instruction complexity 8.
* Complexity 1: Approximately 14.5%
* Complexity 2: Approximately 11.8%
* Complexity 3: Approximately 9.5%
* Complexity 4: Approximately 7.3%
* Complexity 5: Approximately 7.3%
* Complexity 6: Approximately 5.2%
* Complexity 7: Approximately 7.2%
* Complexity 8: Approximately 14.2%
* **M2 (red, squares):** The win rate decreases from instruction complexity 1 to 6, then increases at instruction complexity 8.
* Complexity 1: Approximately 23.5%
* Complexity 2: Approximately 17.5%
* Complexity 3: Approximately 14%
* Complexity 4: Approximately 15.5%
* Complexity 5: Approximately 16%
* Complexity 6: Approximately 9%
* Complexity 7: Approximately 12.3%
* Complexity 8: Approximately 14.2%
* **M3 (orange, diamonds):** The win rate is relatively stable, fluctuating between 18% and 27%.
* Complexity 1: Approximately 26.3%
* Complexity 2: Approximately 19%
* Complexity 3: Approximately 18.5%
* Complexity 4: Approximately 18%
* Complexity 5: Approximately 26.3%
* Complexity 6: Approximately 21.8%
* Complexity 7: Approximately 23.8%
* Complexity 8: Approximately 27.5%
### Key Observations
* M0 and M1 exhibit a similar trend: a decrease in win rate as instruction complexity increases from 1 to 6, followed by a sharp increase at complexity 8.
* M2 shows a similar trend to M0 and M1, but the increase at complexity 8 is less pronounced.
* M3 maintains a relatively stable win rate across all instruction complexities, with a peak at complexity 1 and 5.
* At instruction complexity 8, M0 experiences a significant surge in win rate, surpassing M1 and M2.
### Interpretation
The data suggests that for M0, M1, and M2, there is an optimal level of instruction complexity beyond which the win rate decreases. However, at the highest complexity level (8), M0 experiences a resurgence in win rate, indicating a potential advantage at very high complexities. M3's consistent performance suggests it is less sensitive to changes in instruction complexity. The relationship between instruction complexity and win rate is not linear and varies significantly between the different data series (M0, M1, M2, and M3), indicating that different strategies or models may perform differently at various complexity levels. The sharp increase in win rate for M0 at complexity 8 could be due to a specific advantage or adaptation that M0 possesses at that level.